
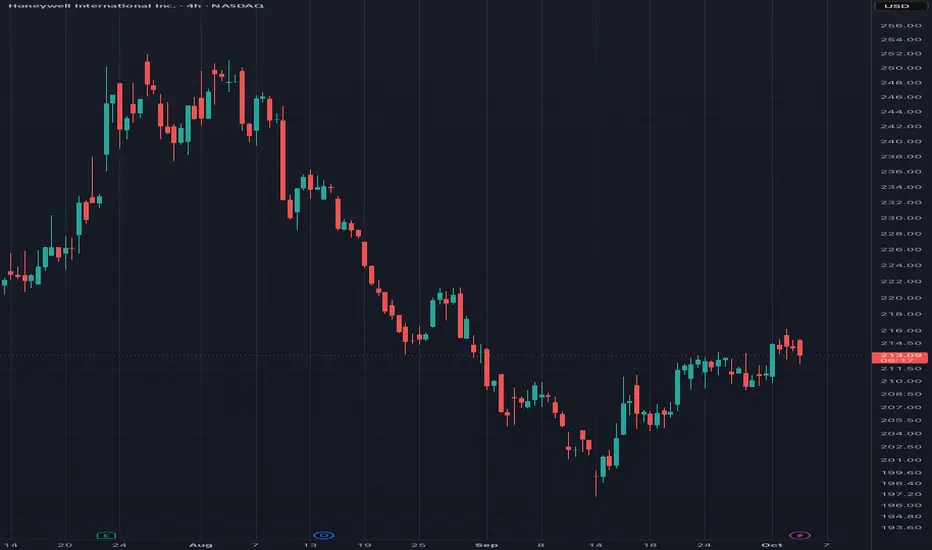
This is an educational framework for reading relative performance across global asset classes instead of treating one symbol in isolation.
The dashboard compares normalized performance of global stocks, bonds, real estate, crypto, gold, silver, oil, the US dollar and money supply. Each series is rebased to 0% at the selected lookback. The table shows the latest value, daily change and a simplified inflow or outflow state.
How to read it:
1. Start with daily change and identify leaders and laggards.
2. Check whether risk assets agree or diverge.
3. Treat divergence as context, not as an automatic entry signal.
4. Adjust the lookback to separate short-term rotation from broader trends.
Limitations:
This dashboard is descriptive, not predictive. It depends on the selected symbols and available data, and missing data can create gaps. It does not forecast returns or replace position sizing, risk limits or independent analysis.
The core idea is simple: compare capital behavior across asset classes and wait for confirmation before acting.
The dashboard compares normalized performance of global stocks, bonds, real estate, crypto, gold, silver, oil, the US dollar and money supply. Each series is rebased to 0% at the selected lookback. The table shows the latest value, daily change and a simplified inflow or outflow state.
How to read it:
1. Start with daily change and identify leaders and laggards.
2. Check whether risk assets agree or diverge.
3. Treat divergence as context, not as an automatic entry signal.
4. Adjust the lookback to separate short-term rotation from broader trends.
Limitations:
This dashboard is descriptive, not predictive. It depends on the selected symbols and available data, and missing data can create gaps. It does not forecast returns or replace position sizing, risk limits or independent analysis.
The core idea is simple: compare capital behavior across asset classes and wait for confirmation before acting.

כתב ויתור
המידע והפרסומים אינם מיועדים להיות, ואינם מהווים, ייעוץ או המלצה פיננסית, השקעתית, מסחרית או מכל סוג אחר המסופקת או מאושרת על ידי TradingView. קרא עוד ב־תנאי השימוש.
כתב ויתור
המידע והפרסומים אינם מיועדים להיות, ואינם מהווים, ייעוץ או המלצה פיננסית, השקעתית, מסחרית או מכל סוג אחר המסופקת או מאושרת על ידי TradingView. קרא עוד ב־תנאי השימוש.