
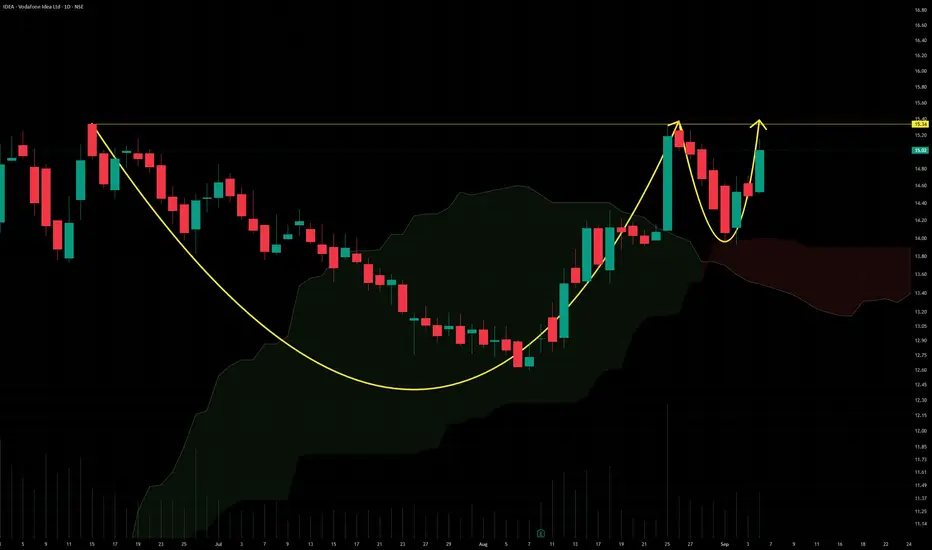
📊 Vodafone Idea (IDEA) Technical Analysis: Bullish Cup & Handle Pattern AlertThe daily chart for Vodafone Idea Ltd. (IDEA) highlights a classic, highly structured Cup and Handle breakout setup. After a prolonged consolidation phase, the bulls are attempting to clear a major multi-month structural milestone.Breakdown of the Setup:The Cup: Formed between mid-June and late August, showing a textbook, smooth, U-shaped rounding bottom. This reveals steady accumulation as buyers gradually absorbed selling pressure at lower levels.The Handle: The quick pullback and consolidation during the final week of August formed a perfect, shallow handle. The fact that the handle found immediate support near the ₹14.00 indicator line indicates strong bullish defense.The Resistance/Neckline (₹15.34): The horizontal yellow resistance line serves as the absolute neckline of the pattern.Current Action: The most recent daily candle closed strong at ₹15.02, charging right back up the right side of the handle with massive buying momentum heading straight for the breakout trigger zone.What This Means for Traders:The Entry Signal: A decisive daily close above ₹15.34 confirms a valid pattern breakout.The Target: According to textbook technical principles, the structural target for a confirmed breakout is determined by projecting the depth of the cup upward. This signals a massive mid-term upside potential if resistance cracks.Invalidation Zone: The pattern remains cleanly intact as long as the price continues to hold above the handle's consolidation floor near ₹14.00.Disclaimer: Educational content only. Not financial advice. Always practice strict risk management.

Sucrit.D.Patil
כתב ויתור
המידע והפרסומים אינם מיועדים להיות, ואינם מהווים, ייעוץ או המלצה פיננסית, השקעתית, מסחרית או מכל סוג אחר המסופקת או מאושרת על ידי TradingView. קרא עוד ב־תנאי השימוש.
Sucrit.D.Patil
כתב ויתור
המידע והפרסומים אינם מיועדים להיות, ואינם מהווים, ייעוץ או המלצה פיננסית, השקעתית, מסחרית או מכל סוג אחר המסופקת או מאושרת על ידי TradingView. קרא עוד ב־תנאי השימוש.