
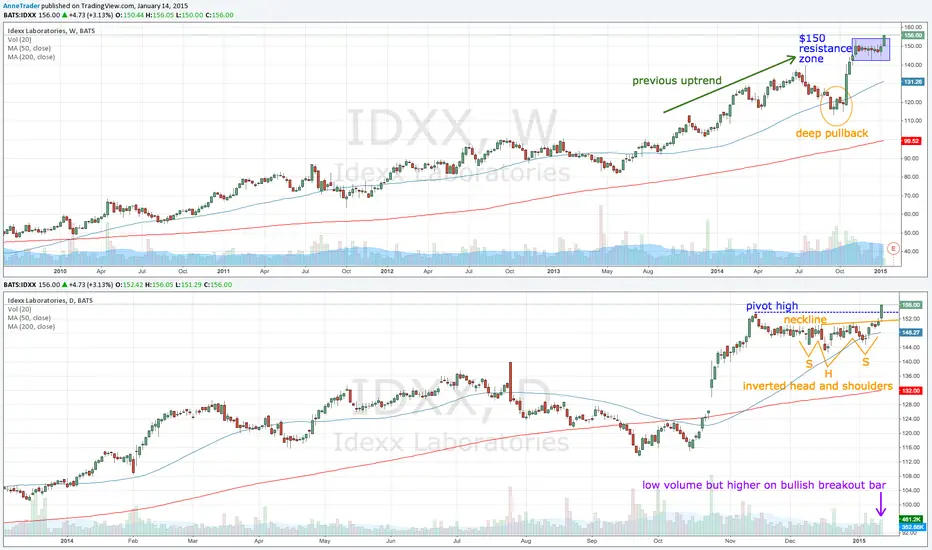
IDXX has just broken up out of a nine week pullback. Price struggled to break above the $150 half-figure zone during that time. Prior to this there was a very deep pullback (September/October 2014) which broke below the weekly 50ma for several weeks.
However, price is currently in an uptrend, despite the recent pullback - which, in fact, formed an inverted head and shoulders pattern suggesting a continuation to the upside. This was confirmed on yesterdays breakout bar - which also broke above the recent pivot high. Volume was up on the bullish bar, too, which all points to a continuation of the uptrend.
Overall, volume is on the low side (which could affect liquidity) but otherwise a good long opportunity.
However, price is currently in an uptrend, despite the recent pullback - which, in fact, formed an inverted head and shoulders pattern suggesting a continuation to the upside. This was confirmed on yesterdays breakout bar - which also broke above the recent pivot high. Volume was up on the bullish bar, too, which all points to a continuation of the uptrend.
Overall, volume is on the low side (which could affect liquidity) but otherwise a good long opportunity.

Web: dt.live
Instagram: instagram.com/dynamictrader
Twitter: twitter.com/dynamictrader
Instagram: instagram.com/dynamictrader
Twitter: twitter.com/dynamictrader
כתב ויתור
המידע והפרסומים אינם מיועדים להיות, ואינם מהווים, ייעוץ או המלצה פיננסית, השקעתית, מסחרית או מכל סוג אחר המסופקת או מאושרת על ידי TradingView. קרא עוד ב־תנאי השימוש.
Web: dt.live
Instagram: instagram.com/dynamictrader
Twitter: twitter.com/dynamictrader
Instagram: instagram.com/dynamictrader
Twitter: twitter.com/dynamictrader
כתב ויתור
המידע והפרסומים אינם מיועדים להיות, ואינם מהווים, ייעוץ או המלצה פיננסית, השקעתית, מסחרית או מכל סוג אחר המסופקת או מאושרת על ידי TradingView. קרא עוד ב־תנאי השימוש.