
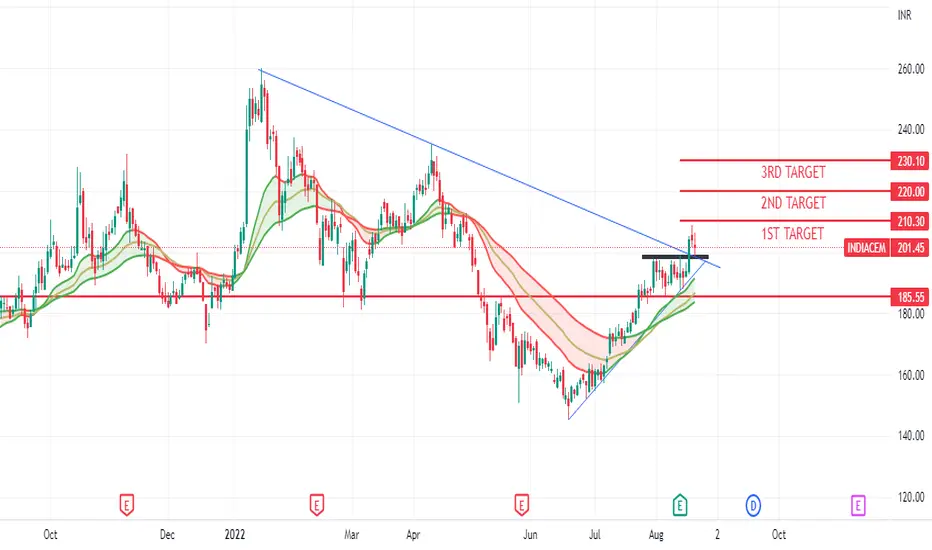
India cement making good price action pattern in daily time frame,
this stock follow more than 200 days trandline resistance and break this trandline with strong bullish candel in daily TF with good volume.
also stock is follow support trandline with good respct.and aslo its PEMA(21,34,55) its turn to flat to sloping upside its best singh for long this stock
my lavels are enter to this stock
BUY = 204-205
TATGET = 210,220,230
STOP LOSS = 195
this stock follow more than 200 days trandline resistance and break this trandline with strong bullish candel in daily TF with good volume.
also stock is follow support trandline with good respct.and aslo its PEMA(21,34,55) its turn to flat to sloping upside its best singh for long this stock
my lavels are enter to this stock
BUY = 204-205
TATGET = 210,220,230
STOP LOSS = 195

כתב ויתור
המידע והפרסומים אינם מיועדים להיות, ואינם מהווים, ייעוץ או המלצה פיננסית, השקעתית, מסחרית או מכל סוג אחר המסופקת או מאושרת על ידי TradingView. קרא עוד ב־תנאי השימוש.
כתב ויתור
המידע והפרסומים אינם מיועדים להיות, ואינם מהווים, ייעוץ או המלצה פיננסית, השקעתית, מסחרית או מכל סוג אחר המסופקת או מאושרת על ידי TradingView. קרא עוד ב־תנאי השימוש.