
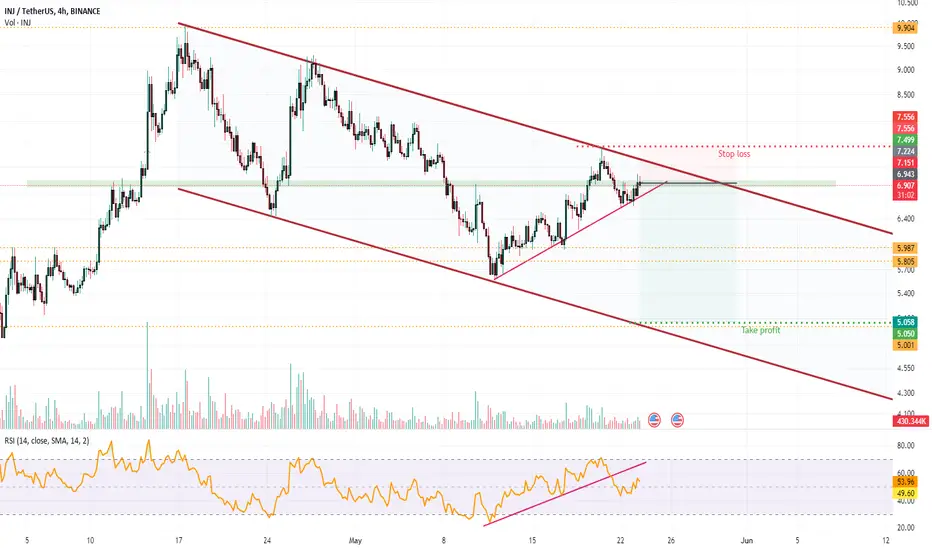
This is what i see in the inj/usdt chart
Nevertheless we need to see:
A lower high;
A trend line break confirmation.
To give more momentum to this trade.
RSI already broke the trend wich is a bullish sign for our analisys.
If the price break up and take my stop loss I assume the loss and move to the next trade.
Expected trade time: 10 to 15 days
Risk/Reward ratio - 1:3
Capital exposure: 125

כתב ויתור
המידע והפרסומים אינם מיועדים להיות, ואינם מהווים, ייעוץ או המלצה פיננסית, השקעתית, מסחרית או מכל סוג אחר המסופקת או מאושרת על ידי TradingView. קרא עוד ב־תנאי השימוש.
כתב ויתור
המידע והפרסומים אינם מיועדים להיות, ואינם מהווים, ייעוץ או המלצה פיננסית, השקעתית, מסחרית או מכל סוג אחר המסופקת או מאושרת על ידי TradingView. קרא עוד ב־תנאי השימוש.