
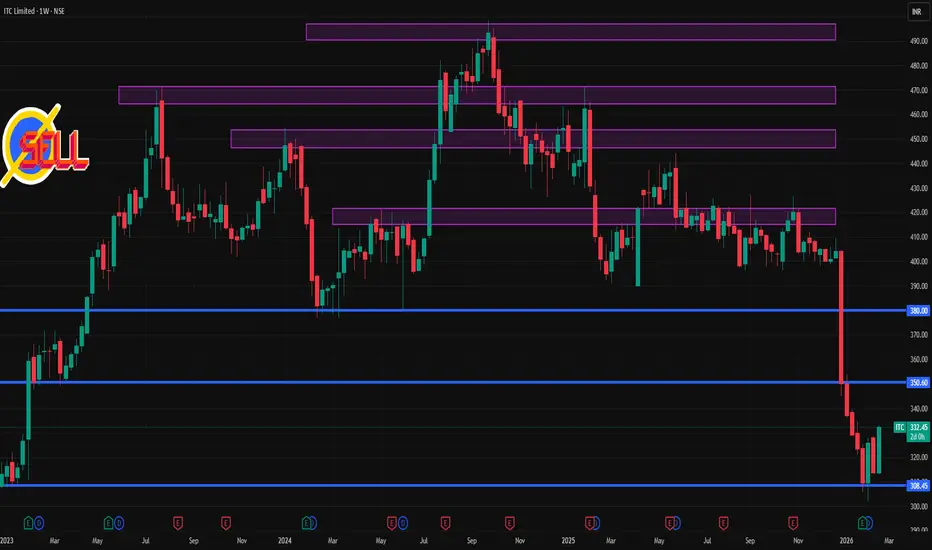
📍 Current Weekly Price
• The stock is trading around ₹331 – ₹335 on NSE/BSE at this point in the week.
📊 1-Week Timeframe — Key Levels (Weekly Pivot & Structures)
🔻 Weekly Support Levels
These are likely areas where buyers may step in this week if price weakens:
• Support 1: ~₹325 – ₹326 (near current range)
• Support 2: ~₹321 – ₹322
• Support 3: ~₹314 – ₹315 — deeper weekly support zone
(Support range based on weekly pivot band analysis on current price context)
🔺 Weekly Resistance Levels
Resistance levels where supply might cap upside this week:
• Immediate Resistance (R1): ~₹336 – ₹337
• R2: ~₹343 – ₹344
• R3: ~₹347 (upper weekly resistance)
(These are derived from pivot / weekly resistance bands)
📌 Weekly Pivot Reference
• Weekly Pivot (Reference): ~₹332 – ₹333
A weekly close above this suggests short-term bullish bias; below this suggests bearish structure.
📈 What This Means (Weekly Technical View)
🔹 Current trend context: The stock has been under pressure recently and is trading near the lower range of its 52-week price band (between ~₹302 low and ₹444 high).
🔹 Bearish bias this week: ITC trading below key moving averages and pivot points typically indicates short-term bearish control unless price breaks above the resistance levels noted above.
🔹 Bullish pivot levels: A weekly close above ~₹336-₹338 would suggest short-term relief and potential move toward higher resistance zones (₹343+).
🔹 Bearish break: A break & weekly close below ~₹325 strengthens downside momentum toward next supports near ₹321 / ₹314.

Contact Knowledgehub for a detailed consultation: Dm on WhatsApp: [wa.link/a2o0kz]-
Phone No: [+91 93102 26243]-
Email: [tradingviewknowledgehub@gmail.com]---
-- Let’s achieve success together!
Phone No: [+91 93102 26243]-
Email: [tradingviewknowledgehub@gmail.com]---
-- Let’s achieve success together!
פרסומים קשורים
כתב ויתור
המידע והפרסומים אינם מיועדים להיות, ואינם מהווים, ייעוץ או המלצה פיננסית, השקעתית, מסחרית או מכל סוג אחר המסופקת או מאושרת על ידי TradingView. קרא עוד ב־תנאי השימוש.