
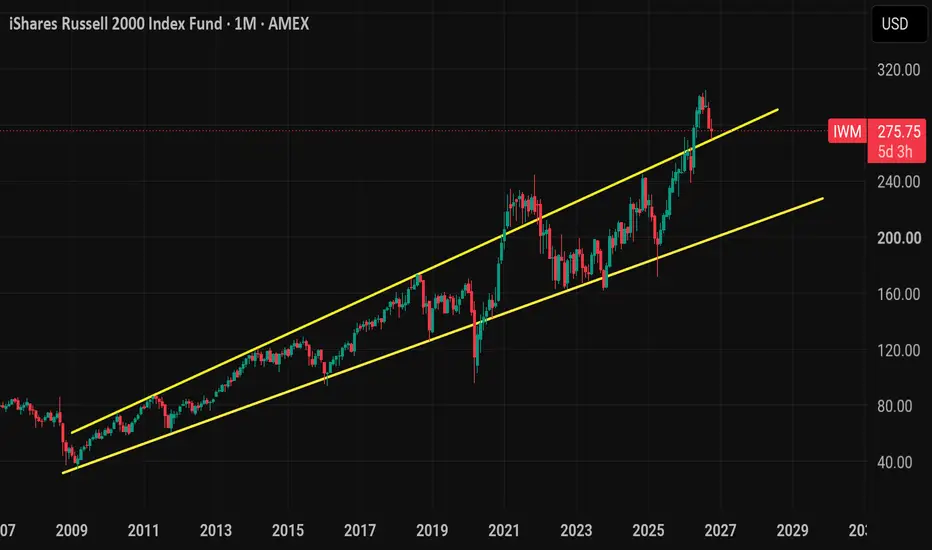
Interesting setup here
Long term, we retesting our previous monthly resistance. A breakout like this happened back during COVID with the stimulus money, but it didn't last. I think after this seasonal run up back to 295-300 we will begin a decline back inside long term channel

Here's a close up of August reversal monthly candle. August closed around 295 and that is where Sellers will be waiting for iwm up there

Now zooming into the weekly , and this is why I think Iwm will bounce.
Since 2009 iwm weekly money flow has only tagged extreme oversold 3 prior times up until now and each time iwm bottomed and rallied for awhile. The positioning was different though; we where at the support where as now we are on top of resistance.

So from this , you have a unsustainable structure with oversold conditions.
I give the edge to the bulls here because of the money flow and seasonality
IWM November seasonality · 2000–2025
81%
Positive Novembers
+3.0%
Average return
21/26
Positive years
As they say, numbers don't lie.
Daily chart

Important price levels
$295–$305 Major upside objective
Prior peak and upper resistance region
$284–$285 First significant hurdle
Early-October reaction area
$277–$280 Immediate decision zone
Near-term resistance and former confluence
$269–$271 Support / failed-bounce warning
Recent swing-low region
Below ~$265 Deeper breakdown risk
Would strengthen the return-inside-channel thesis
I think the low will be set this week and if 265 holds 295 by end of NOV
Long term, we retesting our previous monthly resistance. A breakout like this happened back during COVID with the stimulus money, but it didn't last. I think after this seasonal run up back to 295-300 we will begin a decline back inside long term channel
Here's a close up of August reversal monthly candle. August closed around 295 and that is where Sellers will be waiting for iwm up there
Now zooming into the weekly , and this is why I think Iwm will bounce.
Since 2009 iwm weekly money flow has only tagged extreme oversold 3 prior times up until now and each time iwm bottomed and rallied for awhile. The positioning was different though; we where at the support where as now we are on top of resistance.
So from this , you have a unsustainable structure with oversold conditions.
I give the edge to the bulls here because of the money flow and seasonality
IWM November seasonality · 2000–2025
81%
Positive Novembers
+3.0%
Average return
21/26
Positive years
As they say, numbers don't lie.
Daily chart
Important price levels
$295–$305 Major upside objective
Prior peak and upper resistance region
$284–$285 First significant hurdle
Early-October reaction area
$277–$280 Immediate decision zone
Near-term resistance and former confluence
$269–$271 Support / failed-bounce warning
Recent swing-low region
Below ~$265 Deeper breakdown risk
Would strengthen the return-inside-channel thesis
I think the low will be set this week and if 265 holds 295 by end of NOV

כתב ויתור
המידע והפרסומים אינם מיועדים להיות, ואינם מהווים, ייעוץ או המלצה פיננסית, השקעתית, מסחרית או מכל סוג אחר המסופקת או מאושרת על ידי TradingView. קרא עוד ב־תנאי השימוש.
כתב ויתור
המידע והפרסומים אינם מיועדים להיות, ואינם מהווים, ייעוץ או המלצה פיננסית, השקעתית, מסחרית או מכל סוג אחר המסופקת או מאושרת על ידי TradingView. קרא עוד ב־תנאי השימוש.