

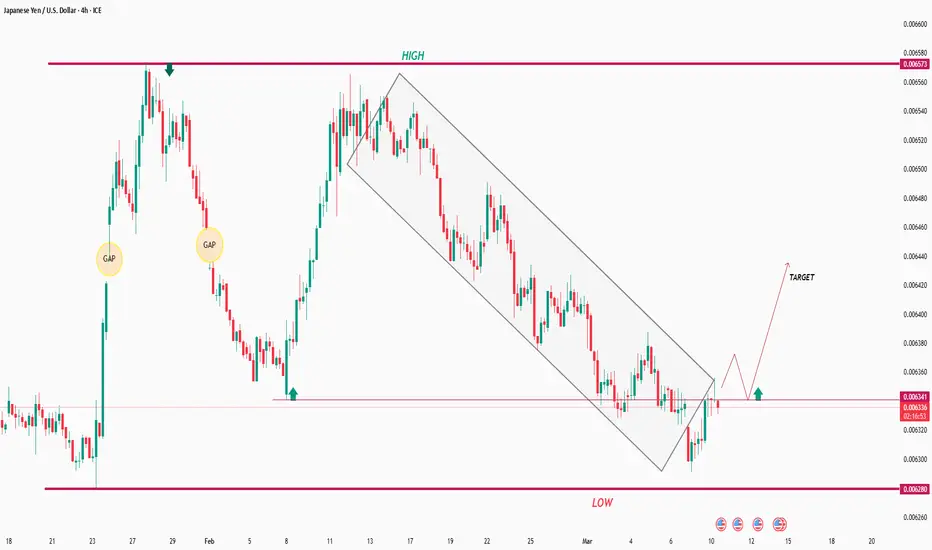
📊 JPY/USD Market Structure Analysis (4H Timeframe)
🧭 Overall Market Context
The chart shows a clear transition from bullish expansion to bearish corrective structure. After printing a major swing high, price entered a well-defined descending channel, indicating sustained short-term bearish pressure.
However, the market is now approaching a critical demand/support zone, where a potential reversal or bullish retracement could occur.
🏗️ Market Structure Breakdown
🔺 1. Previous Bullish Expansion
The left side of the chart shows strong impulsive bullish momentum.
Price created two visible gaps (inefficiencies) during the aggressive move up.
These gaps indicate institutional displacement, often followed by later rebalancing.
📌 Key observation:
After reaching the major resistance (0.00657 area), buyers lost control.
🔻 2. Formation of the Bearish Channel
After the high formed, the market shifted into:
➡️ Lower Highs (LH)
➡️ Lower Lows (LL)
This created the descending channel visible on the chart.
Characteristics of this phase:
Controlled selling
Consistent respect of the channel boundaries
Gradual liquidity draw toward lower levels
📉 This structure signals distribution and bearish correction rather than immediate bullish continuation.
📉 Liquidity & Support Zone
🟢 Current Reaction Area (0.00633 – 0.00634)
Price is currently sitting on a key horizontal support zone.
Reasons this level is important:
✔ Previous structure reaction
✔ Near channel breakout area
✔ Liquidity resting below
✔ Possible accumulation zone
This level acts as a decision point for the market.
🔄 Potential Scenario (Bullish Reversal Setup)
The chart suggests a possible bullish recovery scenario:
Step 1️⃣
Price holds the 0.00633 support zone
Step 2️⃣
Break above the local micro resistance
Step 3️⃣
Retest the breakout level
Step 4️⃣
Continuation toward the target zone
🎯 Projected Target
Around 0.00640 – 0.00645
This aligns with:
Prior minor structure
Internal liquidity inside the channel.
⚠️ Bearish Risk Scenario
If price fails to hold the support level:
📉 Expect continuation toward:
0.00628 – Major Support (LOW)
Break below this level could trigger:
Liquidity sweep
Deeper bearish continuation
Possible expansion lower.
📊 Key Levels to Watch
Level Type Importance
0.00657 Major Resistance Previous swing high
0.00640 – 0.00645 Target Zone Short-term bullish objective
0.00633 Current Support Decision level
0.00628 Major Support Liquidity & downside risk
🧠 Professional Trading Insight
💡 This setup represents a classic structure shift opportunity:
A break of the descending channel
Followed by support holding
Could trigger a short-term bullish correction
But confirmation requires:
✔ Break of minor resistance
✔ Higher low formation
✔ Volume expansion
Without confirmation, the market may continue ranging or drop lower.
🏁 Final Market Bias
📉 Short-Term Bias: Neutral → Potential Bullish Retracement
📈 Confirmation Level: Break above 0.00636 – 0.00637
📊 Invalidation: Break below 0.00628
✅ Professional Summary
The market is currently at a critical support and channel breakout zone.
If buyers defend the level, we could see a technical bounce toward 0.00640+.
However, failure to hold support will likely trigger another bearish leg.
🧭 Overall Market Context
The chart shows a clear transition from bullish expansion to bearish corrective structure. After printing a major swing high, price entered a well-defined descending channel, indicating sustained short-term bearish pressure.
However, the market is now approaching a critical demand/support zone, where a potential reversal or bullish retracement could occur.
🏗️ Market Structure Breakdown
🔺 1. Previous Bullish Expansion
The left side of the chart shows strong impulsive bullish momentum.
Price created two visible gaps (inefficiencies) during the aggressive move up.
These gaps indicate institutional displacement, often followed by later rebalancing.
📌 Key observation:
After reaching the major resistance (0.00657 area), buyers lost control.
🔻 2. Formation of the Bearish Channel
After the high formed, the market shifted into:
➡️ Lower Highs (LH)
➡️ Lower Lows (LL)
This created the descending channel visible on the chart.
Characteristics of this phase:
Controlled selling
Consistent respect of the channel boundaries
Gradual liquidity draw toward lower levels
📉 This structure signals distribution and bearish correction rather than immediate bullish continuation.
📉 Liquidity & Support Zone
🟢 Current Reaction Area (0.00633 – 0.00634)
Price is currently sitting on a key horizontal support zone.
Reasons this level is important:
✔ Previous structure reaction
✔ Near channel breakout area
✔ Liquidity resting below
✔ Possible accumulation zone
This level acts as a decision point for the market.
🔄 Potential Scenario (Bullish Reversal Setup)
The chart suggests a possible bullish recovery scenario:
Step 1️⃣
Price holds the 0.00633 support zone
Step 2️⃣
Break above the local micro resistance
Step 3️⃣
Retest the breakout level
Step 4️⃣
Continuation toward the target zone
🎯 Projected Target
Around 0.00640 – 0.00645
This aligns with:
Prior minor structure
Internal liquidity inside the channel.
⚠️ Bearish Risk Scenario
If price fails to hold the support level:
📉 Expect continuation toward:
0.00628 – Major Support (LOW)
Break below this level could trigger:
Liquidity sweep
Deeper bearish continuation
Possible expansion lower.
📊 Key Levels to Watch
Level Type Importance
0.00657 Major Resistance Previous swing high
0.00640 – 0.00645 Target Zone Short-term bullish objective
0.00633 Current Support Decision level
0.00628 Major Support Liquidity & downside risk
🧠 Professional Trading Insight
💡 This setup represents a classic structure shift opportunity:
A break of the descending channel
Followed by support holding
Could trigger a short-term bullish correction
But confirmation requires:
✔ Break of minor resistance
✔ Higher low formation
✔ Volume expansion
Without confirmation, the market may continue ranging or drop lower.
🏁 Final Market Bias
📉 Short-Term Bias: Neutral → Potential Bullish Retracement
📈 Confirmation Level: Break above 0.00636 – 0.00637
📊 Invalidation: Break below 0.00628
✅ Professional Summary
The market is currently at a critical support and channel breakout zone.
If buyers defend the level, we could see a technical bounce toward 0.00640+.
However, failure to hold support will likely trigger another bearish leg.

פרסומים קשורים
כתב ויתור
המידע והפרסומים אינם מיועדים להיות, ואינם מהווים, ייעוץ או המלצה פיננסית, השקעתית, מסחרית או מכל סוג אחר המסופקת או מאושרת על ידי TradingView. קרא עוד ב־תנאי השימוש.
פרסומים קשורים
כתב ויתור
המידע והפרסומים אינם מיועדים להיות, ואינם מהווים, ייעוץ או המלצה פיננסית, השקעתית, מסחרית או מכל סוג אחר המסופקת או מאושרת על ידי TradingView. קרא עוד ב־תנאי השימוש.