KDA falling wedge
#KDA/USDT
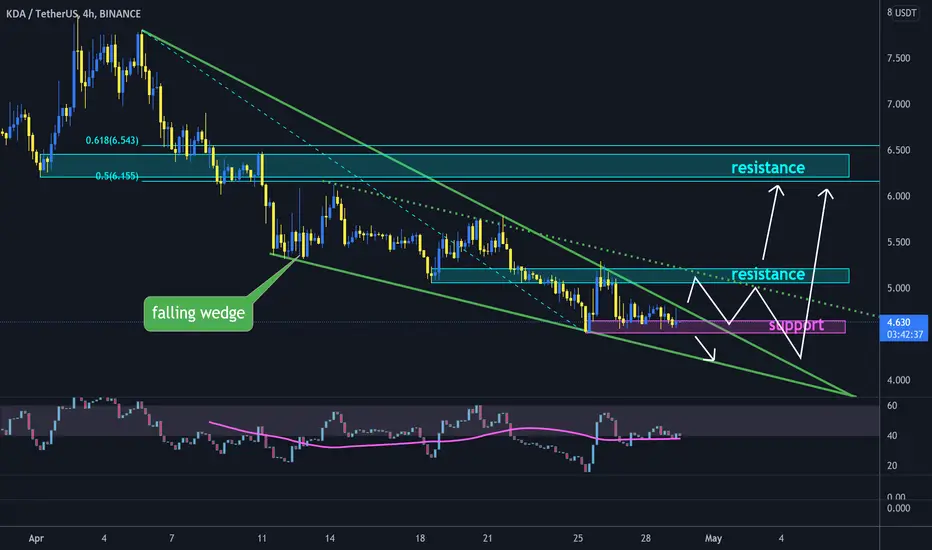
 KDA is inside falling wedge pattern.
🐮 holding support zone can head up price to break out from upper line of wedge to reach resistance zone that is the same with descending trend line parallel to lower line of wedge.
break out this resistance can increase price to resistance zone between 0.5 and 0.618 fib levels.
🐻 break down from current support zone will drop price to lower line of wedge.
KDA is inside falling wedge pattern.🐮 holding support zone can head up price to break out from upper line of wedge to reach resistance zone that is the same with descending trend line parallel to lower line of wedge.
break out this resistance can increase price to resistance zone between 0.5 and 0.618 fib levels.
🐻 break down from current support zone will drop price to lower line of wedge.

כתב ויתור
המידע והפרסומים אינם מיועדים להיות, ואינם מהווים, ייעוץ או המלצה פיננסית, השקעתית, מסחרית או מכל סוג אחר המסופקת או מאושרת על ידי TradingView. קרא עוד ב־תנאי השימוש.
כתב ויתור
המידע והפרסומים אינם מיועדים להיות, ואינם מהווים, ייעוץ או המלצה פיננסית, השקעתית, מסחרית או מכל סוג אחר המסופקת או מאושרת על ידי TradingView. קרא עוד ב־תנאי השימוש.