 KOSPI
KOSPI 📈 Korea's "Talk of the Town" Index at a Critical Inflection Point — Breakout or Bull Trap? 🇰🇷
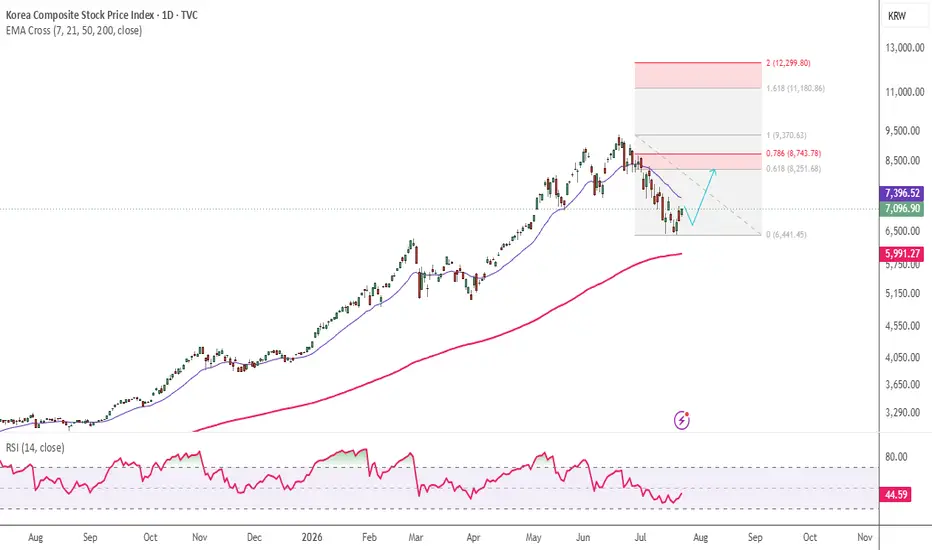
After forming a convincing double bottom near the 6,440 zone, the index has staged a healthy rebound and is now approaching the 20-day EMA, a key dynamic resistance level that could determine the next major trend.
The coming weeks may define whether this recovery evolves into a sustained uptrend—or proves to be another relief rally.
🔍 Technical Outlook
The recent double-bottom formation suggests buyers have successfully defended a major support zone, improving short-term market sentiment.
However, the real test begins now.
📌 A sustained move above the 20 EMA would strengthen the bullish case and could open the door toward the 0.618 Fibonacci retracement zone around 8,250–8,500.
This area represents a major technical resistance and a likely profit-taking zone.
⚠️ Make-or-Break Zone
The 8,250–8,500 region will be the most important level to monitor.
If price forms a Lower High (LH) within this resistance zone, it would indicate that sellers remain in control and many traders may choose to reduce exposure by selling into strength.
This would increase the probability of another leg lower.
🏭
 005930 Samsung &
  000660 SK Hynix Hold the Key
The performance of Samsung Electronics (
005930) and SK Hynix (000660) will likely play a decisive role in determining the index's direction.As two of the largest constituents, any disappointing earnings, weakening semiconductor demand, or negative macroeconomic developments could significantly impact market sentiment at this critical technical level.
📉 Bearish Scenario
Failure to reclaim and sustain above the resistance zone could weaken investor confidence.
In that case, the index may gradually retrace toward the 200-day EMA, currently positioned near the 6,000 level, where long-term buyers may look for renewed opportunities.
🚀 Bullish Scenario
On the other hand, if the index successfully clears 8,500 with strong momentum, expanding volume, and broad market participation, it would confirm a structural breakout.
The next major objective would be the 1.618 Reverse Fibonacci Extension, projecting a potential upside target near 11,000.
📊 My View
The index has reached a high-stakes technical decision point.
✅ Hold above the 20 EMA → Bullish momentum strengthens.
✅ Break above 8,500 → Opens the path toward 11,000.
❌ Rejection and a Lower High → Raises the probability of a decline toward the 200 EMA near 6,000.
This is a classic risk-versus-reward zone where technicals and fundamentals are likely to converge.
Will this recovery evolve into the next major bull leg, or is the market setting up another bull trap? Share your outlook below. 👇
🔖 Hashtags
#KOSPI #KoreaStockMarket #KRX #SamsungElectronics #SKHynix #Semiconductor #TechnicalAnalysis #TradingView #PriceAction #MarketStructure #DoubleBottom #EMA20 #EMA200 #Fibonacci #ReverseFibonacci #Breakout #BullTrap #SupportAndResistance #SwingTrading #TrendFollowing #MarketAnalysis #StockMarket #Investing #TradingIdeas #ChartAnalysis #MarketOutlook #WiSHFundManagement

כתב ויתור
המידע והפרסומים אינם מיועדים להיות, ואינם מהווים, ייעוץ או המלצה פיננסית, השקעתית, מסחרית או מכל סוג אחר המסופקת או מאושרת על ידי TradingView. קרא עוד ב־תנאי השימוש.
כתב ויתור
המידע והפרסומים אינם מיועדים להיות, ואינם מהווים, ייעוץ או המלצה פיננסית, השקעתית, מסחרית או מכל סוג אחר המסופקת או מאושרת על ידי TradingView. קרא עוד ב־תנאי השימוש.