שורט
KP3RUSDT is testing the support
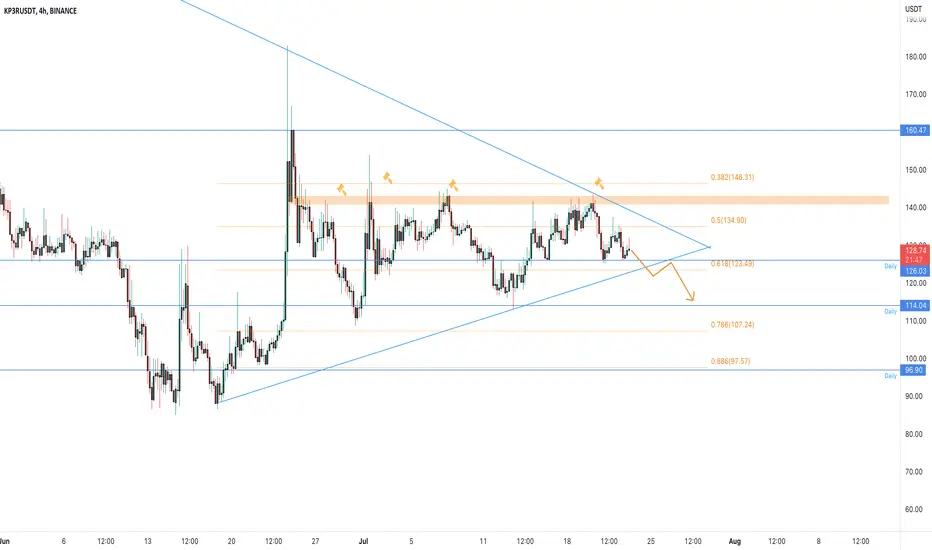
The price created a big triangle on the daily timeframe and now the market is testing the daily support at 128$ on 0.618 Fibonacci level.
On the 4h timeframe, the price got several rejections from 140$ area where the market created a local resistance after a nice bullish movement from 90$ area.
How to approach it?
IF the price is going to lose the 0.618 Fibonacci level support, we could see a bearish impulse until the previous support, so, According to Plancton's strategy, we can set a nice order
–––––
Keep in mind.
–––––
Follow the Shrimp 🦐
On the 4h timeframe, the price got several rejections from 140$ area where the market created a local resistance after a nice bullish movement from 90$ area.
How to approach it?
IF the price is going to lose the 0.618 Fibonacci level support, we could see a bearish impulse until the previous support, so, According to Plancton's strategy, we can set a nice order
–––––
Keep in mind.
- 🟣 Purple structure -> Monthly structure.
- 🔴 Red structure -> Weekly structure.
- 🔵 Blue structure -> Daily structure.
- 🟡 Yellow structure -> 4h structure.
–––––
Follow the Shrimp 🦐
הערה
we are waiting for the clear breakout. Beware of Fake breakout.As you know, the price needs to confirm the breakout with our strategies
הערה
Breakout and MTB strategy.5% so far
הערה
the price followed my arrow. 8%
כתב ויתור
המידע והפרסומים אינם מיועדים להיות, ואינם מהווים, ייעוץ או המלצה פיננסית, השקעתית, מסחרית או מכל סוג אחר המסופקת או מאושרת על ידי TradingView. קרא עוד ב־תנאי השימוש.
כתב ויתור
המידע והפרסומים אינם מיועדים להיות, ואינם מהווים, ייעוץ או המלצה פיננסית, השקעתית, מסחרית או מכל סוג אחר המסופקת או מאושרת על ידי TradingView. קרא עוד ב־תנאי השימוש.