
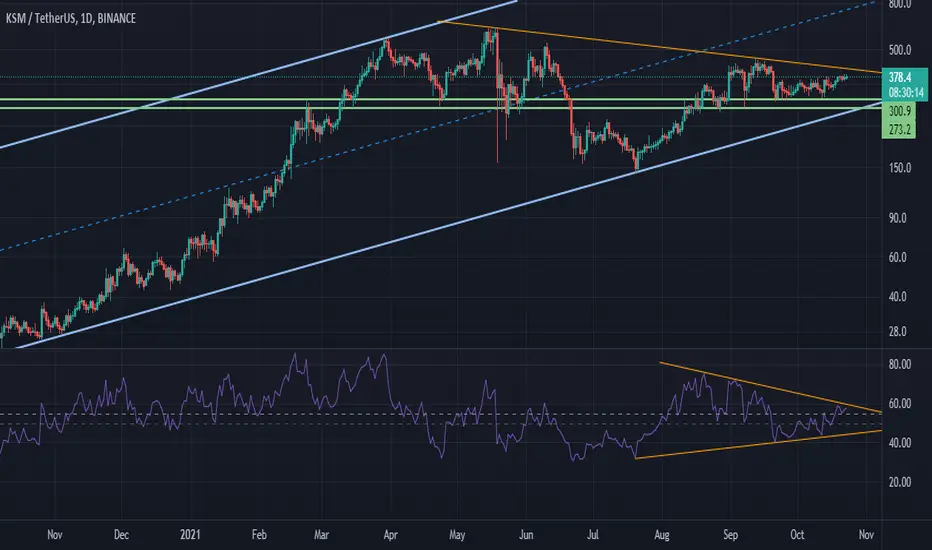
It has a chart similar to the Bitcoin chart when it was priced at $ 40,000
There is a lot of room for growth if you cross the trend line
Shopping in steps is the best way
For the next two months, any negative amount on this chart is just a good buy position
There is a lot of room for growth if you cross the trend line
Shopping in steps is the best way
For the next two months, any negative amount on this chart is just a good buy position

כתב ויתור
המידע והפרסומים אינם מיועדים להיות, ואינם מהווים, ייעוץ או המלצה פיננסית, השקעתית, מסחרית או מכל סוג אחר המסופקת או מאושרת על ידי TradingView. קרא עוד ב־תנאי השימוש.
כתב ויתור
המידע והפרסומים אינם מיועדים להיות, ואינם מהווים, ייעוץ או המלצה פיננסית, השקעתית, מסחרית או מכל סוג אחר המסופקת או מאושרת על ידי TradingView. קרא עוד ב־תנאי השימוש.