
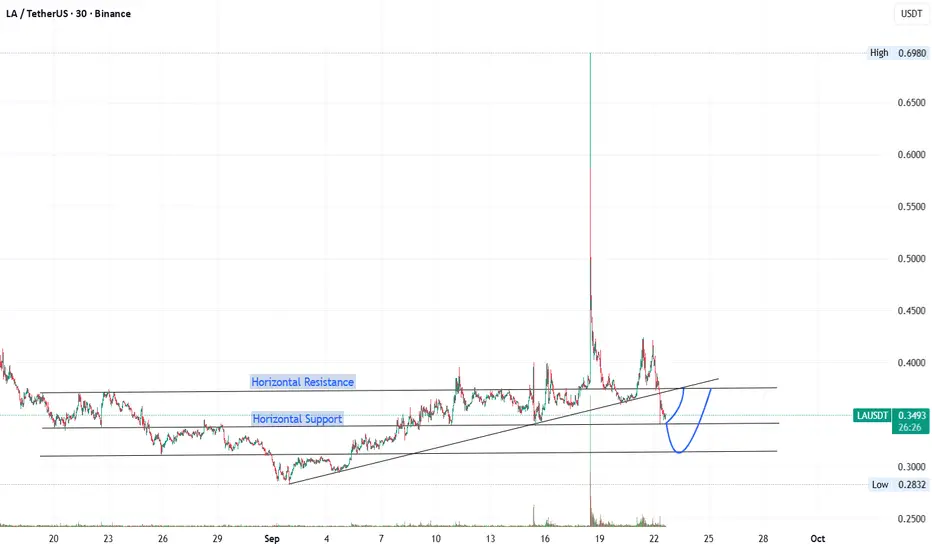
Support levels: You’ve correctly marked two horizontal supports. The lower one around 0.283 (recent low) and the higher one around 0.34–0.35 zone.
Trendline: There’s a clear ascending trendline, which price briefly broke below before bouncing back.
Volume spike: That huge wick up to 0.6980 looks like a liquidity grab or abnormal spike, not a sustained move.
Current structure: Price is testing the horizontal support at ~0.34 after breaking trendline support. Your curved arrow suggests a rebound from support back toward resistance.
Trendline: There’s a clear ascending trendline, which price briefly broke below before bouncing back.
Volume spike: That huge wick up to 0.6980 looks like a liquidity grab or abnormal spike, not a sustained move.
Current structure: Price is testing the horizontal support at ~0.34 after breaking trendline support. Your curved arrow suggests a rebound from support back toward resistance.
- Bullish scenario: Hold above 0.34 → retest 0.38–0.40 area.
- Bearish scenario: Lose 0.34 → likely retest 0.28.

כתב ויתור
המידע והפרסומים אינם מיועדים להיות, ואינם מהווים, ייעוץ או המלצה פיננסית, השקעתית, מסחרית או מכל סוג אחר המסופקת או מאושרת על ידי TradingView. קרא עוד ב־תנאי השימוש.
כתב ויתור
המידע והפרסומים אינם מיועדים להיות, ואינם מהווים, ייעוץ או המלצה פיננסית, השקעתית, מסחרית או מכל סוג אחר המסופקת או מאושרת על ידי TradingView. קרא עוד ב־תנאי השימוש.