
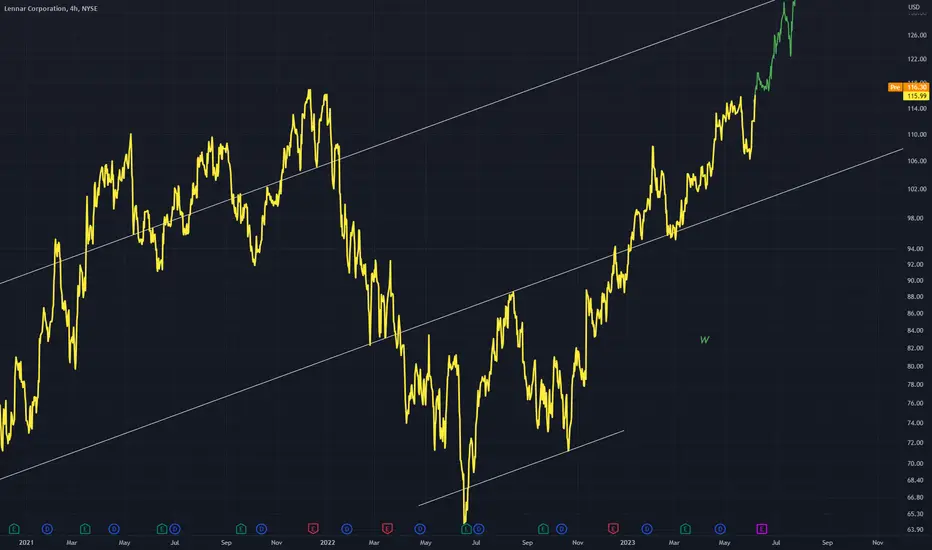
A W pattern on this 4Hr chart.
Basically price just plays out in the shape of a W with the right arm being the main bullish phase which can be seen on chart.
The middle does not necessarily have to be lower (as it is on this chart) for it to be a W pattern still.
Basically price just plays out in the shape of a W with the right arm being the main bullish phase which can be seen on chart.
The middle does not necessarily have to be lower (as it is on this chart) for it to be a W pattern still.

כתב ויתור
המידע והפרסומים אינם מיועדים להיות, ואינם מהווים, ייעוץ או המלצה פיננסית, השקעתית, מסחרית או מכל סוג אחר המסופקת או מאושרת על ידי TradingView. קרא עוד ב־תנאי השימוש.
כתב ויתור
המידע והפרסומים אינם מיועדים להיות, ואינם מהווים, ייעוץ או המלצה פיננסית, השקעתית, מסחרית או מכל סוג אחר המסופקת או מאושרת על ידי TradingView. קרא עוד ב־תנאי השימוש.