
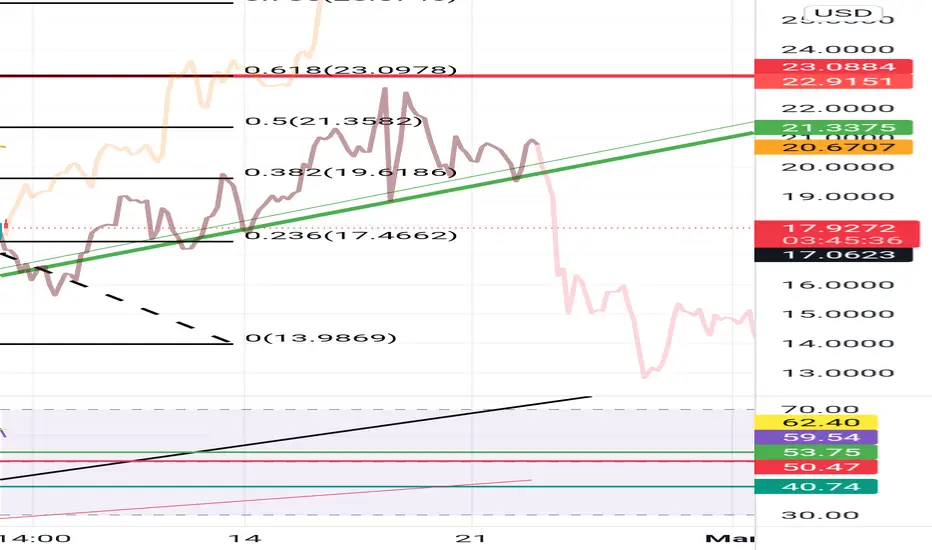
This will chart chainlinks performance on a 4 hour chart
The orange line represents the highs 200 days ago today and the black line represents the highs 100 days ago today.
I placed them along the current highs as of 1500 hours today. This is just done out of morbid curiosity.
The orange line represents the highs 200 days ago today and the black line represents the highs 100 days ago today.
I placed them along the current highs as of 1500 hours today. This is just done out of morbid curiosity.

כתב ויתור
המידע והפרסומים אינם מיועדים להיות, ואינם מהווים, ייעוץ או המלצה פיננסית, השקעתית, מסחרית או מכל סוג אחר המסופקת או מאושרת על ידי TradingView. קרא עוד ב־תנאי השימוש.
כתב ויתור
המידע והפרסומים אינם מיועדים להיות, ואינם מהווים, ייעוץ או המלצה פיננסית, השקעתית, מסחרית או מכל סוג אחר המסופקת או מאושרת על ידי TradingView. קרא עוד ב־תנאי השימוש.