
So i have already posted a chart of my Bullish outlook on the BTc pair for LTC so far so good. Now i think it's about time i do the USD comparative.
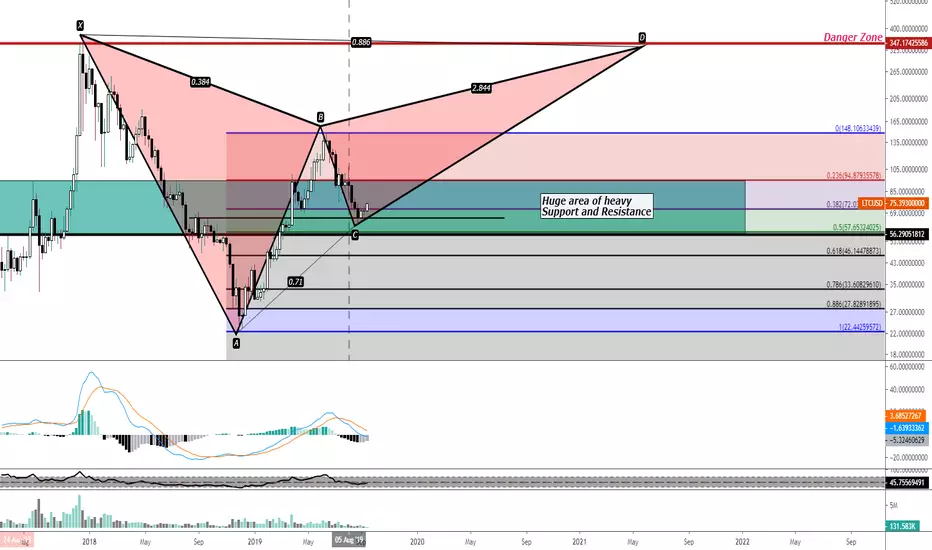
As you can see in the chart we are in a major area right now and we seem to be trying to get above and out of it and at the same time we seem to be forming a harmonic pattern.
it's a bearish one but one can go long on the swings especially considering how much of a move up this last wave potentially has for us.
The PCZ of the pattern happens to line up with the ATH So if we can break out of this critical area i see no reason why LTC wont continue it's ascent back to the 300s.
As you can see in the chart we are in a major area right now and we seem to be trying to get above and out of it and at the same time we seem to be forming a harmonic pattern.
it's a bearish one but one can go long on the swings especially considering how much of a move up this last wave potentially has for us.
The PCZ of the pattern happens to line up with the ATH So if we can break out of this critical area i see no reason why LTC wont continue it's ascent back to the 300s.
הערה
LTC has broken it's support. careful as LTc can go as low as the 886 retrace and still be a valid bat harmonic.that's some where around 20-35 dollarsעסקה סגורה: היעד הושג
Looks like we actually reached out PCZ after bouncing off the 20-35 dollar area. Congrats to those who held through but now is likely the time to let go.

פרסומים קשורים
כתב ויתור
המידע והפרסומים אינם מיועדים להיות, ואינם מהווים, ייעוץ או המלצה פיננסית, השקעתית, מסחרית או מכל סוג אחר המסופקת או מאושרת על ידי TradingView. קרא עוד ב־תנאי השימוש.
פרסומים קשורים
כתב ויתור
המידע והפרסומים אינם מיועדים להיות, ואינם מהווים, ייעוץ או המלצה פיננסית, השקעתית, מסחרית או מכל סוג אחר המסופקת או מאושרת על ידי TradingView. קרא עוד ב־תנאי השימוש.