
👋🏻 Welcome to SatoshiFrame.
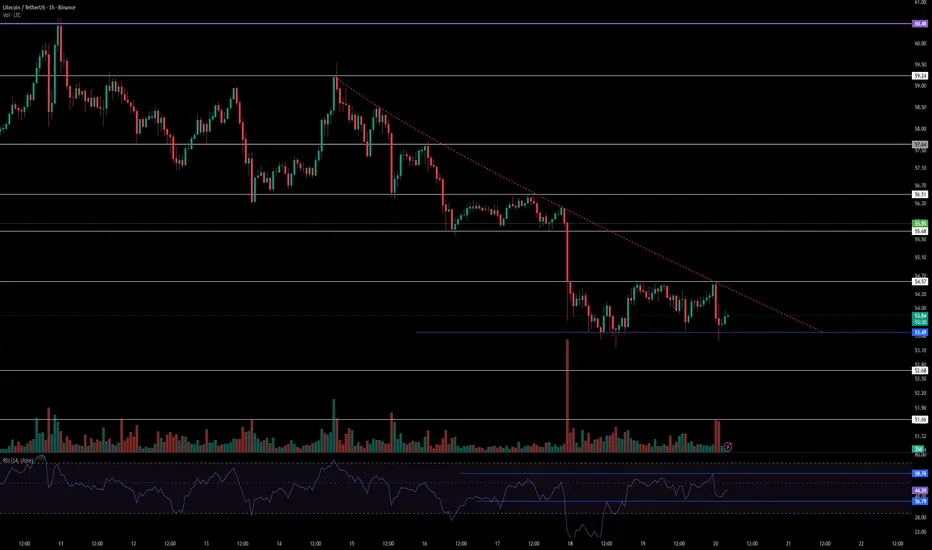
🤑 Litecoin is currently moving inside a compressed range on the 1-hour timeframe after a sharp bearish move. Price is trading between the $53.49 support and the $54.57 resistance zone, while the overall market structure still remains bearish under the dynamic trend resistance.
👍 The bullish scenario becomes more valid if buyers manage to break above the $54.57 resistance with strong momentum and rising buy volume. A confirmed breakout could open the path toward higher resistance levels around $55.68 and $56.51, where traders may consider scaling into positions.
✔️ On the bearish side, losing the $53.49 support could trigger another downside move in line with the dominant trend. If price stabilizes below this level with increasing sell volume, the probability of continuation toward lower support zones becomes significantly stronger.
🧮 RSI is still moving inside a neutral range, showing that the market has not made a final decision yet. A breakout above the 58.76 RSI level could support bullish momentum, while a drop below 36.79 may confirm increasing bearish pressure and trend continuation.
⚠️ Risk management and capital management are the most important parts of trading. Always trade based on your own strategy and risk tolerance. Every trade and trading decision is entirely your own responsibility.
🤑 Litecoin is currently moving inside a compressed range on the 1-hour timeframe after a sharp bearish move. Price is trading between the $53.49 support and the $54.57 resistance zone, while the overall market structure still remains bearish under the dynamic trend resistance.
👍 The bullish scenario becomes more valid if buyers manage to break above the $54.57 resistance with strong momentum and rising buy volume. A confirmed breakout could open the path toward higher resistance levels around $55.68 and $56.51, where traders may consider scaling into positions.
✔️ On the bearish side, losing the $53.49 support could trigger another downside move in line with the dominant trend. If price stabilizes below this level with increasing sell volume, the probability of continuation toward lower support zones becomes significantly stronger.
🧮 RSI is still moving inside a neutral range, showing that the market has not made a final decision yet. A breakout above the 58.76 RSI level could support bullish momentum, while a drop below 36.79 may confirm increasing bearish pressure and trend continuation.
⚠️ Risk management and capital management are the most important parts of trading. Always trade based on your own strategy and risk tolerance. Every trade and trading decision is entirely your own responsibility.

פרסומים קשורים
כתב ויתור
המידע והפרסומים אינם מיועדים להיות, ואינם מהווים, ייעוץ או המלצה פיננסית, השקעתית, מסחרית או מכל סוג אחר המסופקת או מאושרת על ידי TradingView. קרא עוד ב־תנאי השימוש.
כתב ויתור
המידע והפרסומים אינם מיועדים להיות, ואינם מהווים, ייעוץ או המלצה פיננסית, השקעתית, מסחרית או מכל סוג אחר המסופקת או מאושרת על ידי TradingView. קרא עוד ב־תנאי השימוש.