
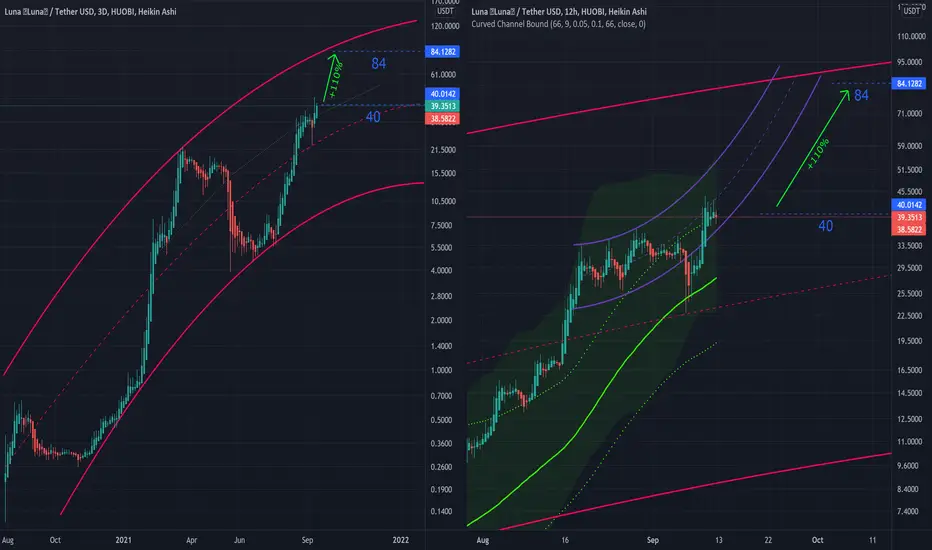
On the LEFT chart there is a big picture of the actual LUNA channel on 3 days candle timeframe.
On the RIGHT chart there is a close up trying to pinpoint dynamic supports (green lines) and limits (green slime) using my curved boundaries indicator. On Violet there is an attempt to find the trajectory where the price can reach the final resistance of this run.
Just sharing my personal charts for learning purposes only. This is not an investment recommendation.
On the RIGHT chart there is a close up trying to pinpoint dynamic supports (green lines) and limits (green slime) using my curved boundaries indicator. On Violet there is an attempt to find the trajectory where the price can reach the final resistance of this run.
Just sharing my personal charts for learning purposes only. This is not an investment recommendation.

כתב ויתור
המידע והפרסומים אינם מיועדים להיות, ואינם מהווים, ייעוץ או המלצה פיננסית, השקעתית, מסחרית או מכל סוג אחר המסופקת או מאושרת על ידי TradingView. קרא עוד ב־תנאי השימוש.
כתב ויתור
המידע והפרסומים אינם מיועדים להיות, ואינם מהווים, ייעוץ או המלצה פיננסית, השקעתית, מסחרית או מכל סוג אחר המסופקת או מאושרת על ידי TradingView. קרא עוד ב־תנאי השימוש.