
MANTAUSDT Technical analsysis update
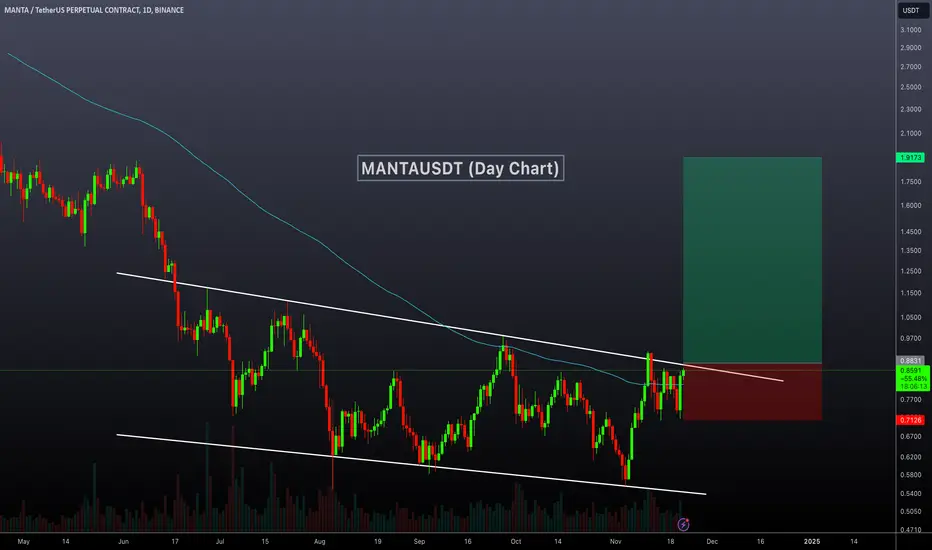
MANTA has been trading within a descending channel for the past 150 days. The price now moves toward the channel's resistance, signaling a potential breakout. Currently, the daily chart shows that the price is trading above 100 EMA. Once a breakout occurs, a strong bullish move can be expected.
Buy zone : Below $0.88
Stop loss : $0.715
Regards
Hexa
MANTA has been trading within a descending channel for the past 150 days. The price now moves toward the channel's resistance, signaling a potential breakout. Currently, the daily chart shows that the price is trading above 100 EMA. Once a breakout occurs, a strong bullish move can be expected.
Buy zone : Below $0.88
Stop loss : $0.715
Regards
Hexa

🚀Telegram : t.me/hexatrades
🌐Website: hexatrades.io/
🗣️Twitter(X): twitter.com/HexaTrades
🌐Website: hexatrades.io/
🗣️Twitter(X): twitter.com/HexaTrades
פרסומים קשורים
כתב ויתור
המידע והפרסומים אינם מיועדים להיות, ואינם מהווים, ייעוץ או המלצה פיננסית, השקעתית, מסחרית או מכל סוג אחר המסופקת או מאושרת על ידי TradingView. קרא עוד ב־תנאי השימוש.
🚀Telegram : t.me/hexatrades
🌐Website: hexatrades.io/
🗣️Twitter(X): twitter.com/HexaTrades
🌐Website: hexatrades.io/
🗣️Twitter(X): twitter.com/HexaTrades
פרסומים קשורים
כתב ויתור
המידע והפרסומים אינם מיועדים להיות, ואינם מהווים, ייעוץ או המלצה פיננסית, השקעתית, מסחרית או מכל סוג אחר המסופקת או מאושרת על ידי TradingView. קרא עוד ב־תנאי השימוש.