MATIC/BTC 1D Short Term
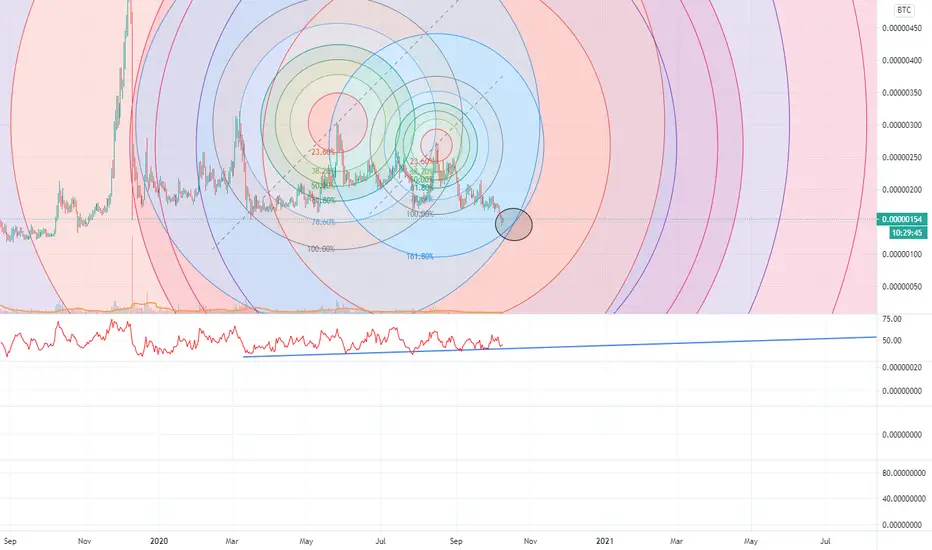
Short term we will drop to 140 sat area, see dark circle that indicates a support/resistance area. After that a rise is possible back to 170 sat area for the first target.
Also see the ultimate oscillator here. The line below the indicator indicates a last drop back to the line, before rising again.
No advice from me, i just look at the charts :)
Also see the ultimate oscillator here. The line below the indicator indicates a last drop back to the line, before rising again.
No advice from me, i just look at the charts :)

כתב ויתור
המידע והפרסומים אינם מיועדים להיות, ואינם מהווים, ייעוץ או המלצה פיננסית, השקעתית, מסחרית או מכל סוג אחר המסופקת או מאושרת על ידי TradingView. קרא עוד ב־תנאי השימוש.
כתב ויתור
המידע והפרסומים אינם מיועדים להיות, ואינם מהווים, ייעוץ או המלצה פיננסית, השקעתית, מסחרית או מכל סוג אחר המסופקת או מאושרת על ידי TradingView. קרא עוד ב־תנאי השימוש.