מעודכן
SasanSeifi 💁♂️MATIC 👉3D 🔻🤔
Hey there,
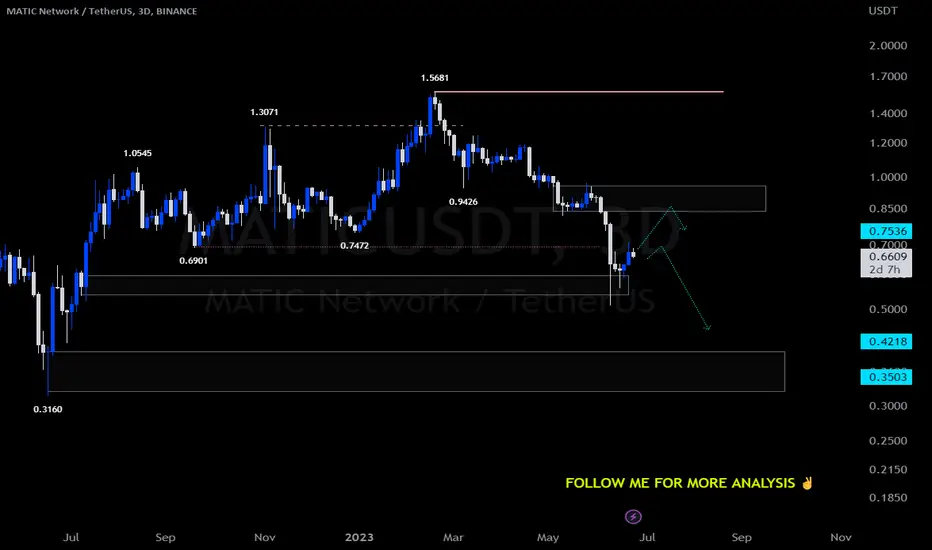
In the long-term timeframe, as you can see, the price has been accompanied by a positive fluctuation of approximately 25% from the demand zone at 0.60. Currently, the potential scenario to consider is as follows: after gathering liquidity from the price range of 0.65 or possibly from the supply area (once confirmed and adjusted further), the price could move towards the price range of 0.50/0.42/0.40.💹
🔱To better understand the continuation of the price movement, it's important to observe how the price reacts to the resistance levels at 0.75/0.85. The price's response to these resistance levels will provide valuable insights. However, if the price manages to break above the significant resistance level of 0.85 and consolidates, there is a possibility of further growth. The potential trends in the image above have also been indicated.❗
Just keep these scenarios in mind as you analyze the market. Remember, things can always change unexpectedly, so stay flexible in your trading approach.❗
Wishing you loads of success in your trading adventures, my friend!✌
❎ (DYOR)...⚠️⚜️
Sure, if you have any more questions or need further clarification, feel free to ask. I'm here to help!
And if you found my analysis helpful, I would appreciate it if you could show your support by liking and commenting. Thank you!🙌
הערה
Based on the most recent analysis, following minor fluctuations within the supply zone, the price encountered a correction.
כתב ויתור
המידע והפרסומים אינם מיועדים להיות, ואינם מהווים, ייעוץ או המלצה פיננסית, השקעתית, מסחרית או מכל סוג אחר המסופקת או מאושרת על ידי TradingView. קרא עוד ב־תנאי השימוש.
כתב ויתור
המידע והפרסומים אינם מיועדים להיות, ואינם מהווים, ייעוץ או המלצה פיננסית, השקעתית, מסחרית או מכל סוג אחר המסופקת או מאושרת על ידי TradingView. קרא עוד ב־תנאי השימוש.