שורט
MATICUSD ❕ downtrend
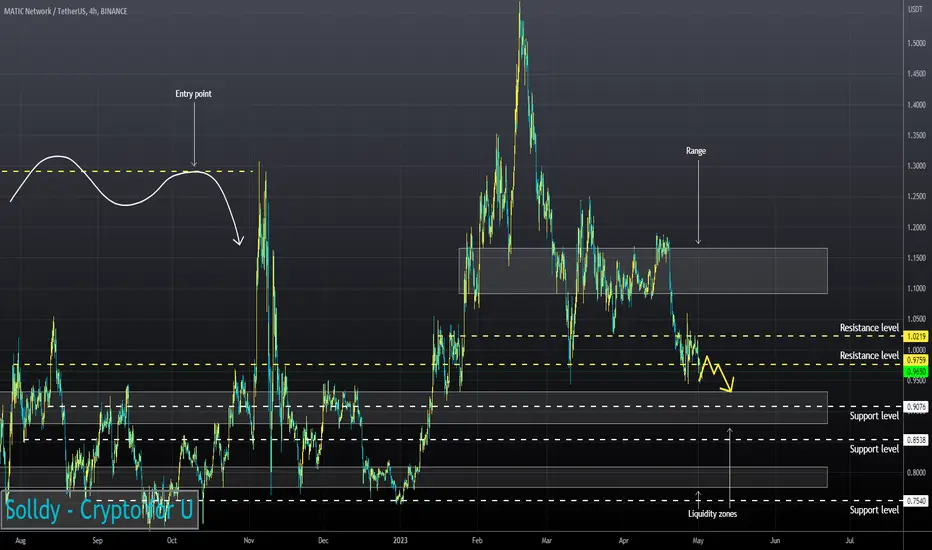
The movement of the RSI chart indicates that the asset continues its movement in a bearish trend and is now testing its upper limit (4H, 1H and 30m TFs)
I believe that the price of the asset will continue to decline if it fixes under the resistance level.
I believe that the price of the asset will continue to decline if it fixes under the resistance level.

כתב ויתור
המידע והפרסומים אינם מיועדים להיות, ואינם מהווים, ייעוץ או המלצה פיננסית, השקעתית, מסחרית או מכל סוג אחר המסופקת או מאושרת על ידי TradingView. קרא עוד ב־תנאי השימוש.
כתב ויתור
המידע והפרסומים אינם מיועדים להיות, ואינם מהווים, ייעוץ או המלצה פיננסית, השקעתית, מסחרית או מכל סוג אחר המסופקת או מאושרת על ידי TradingView. קרא עוד ב־תנאי השימוש.