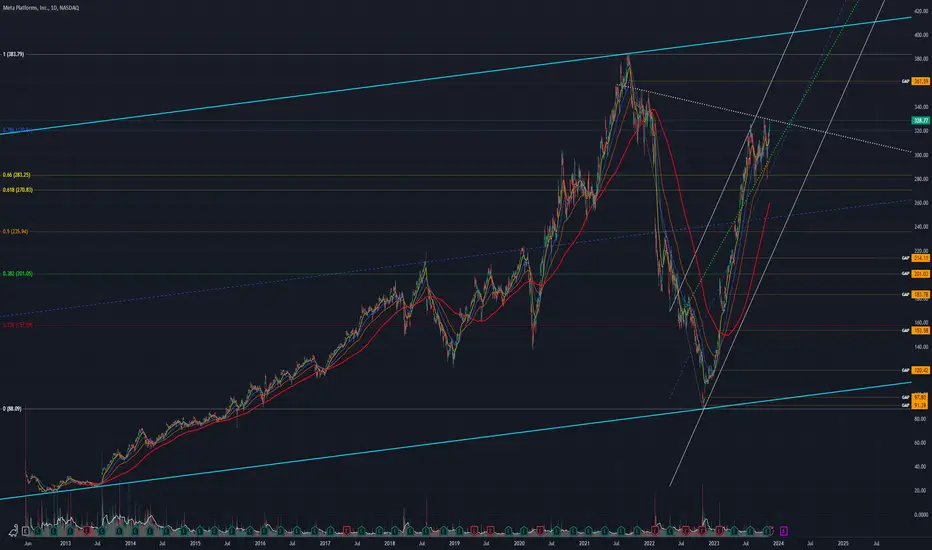
 META chart mapping/analysis.
Bullish consolidation higher within an ascending parallel channel (white).
Bull target(s)
- Breakout above descending trend-line resistance (white dotted)
- Overhead gap fill (~361.59)
- Prev ATH + upper range of parallel channel (light blue) confluence resistance zone
Bear target(s)
- Ascending trend-line support (green dotted)
- Golden Fib Pocket
- Lower range of ascending parallel channel (white)
- 50% Fib
- Underlying gap fills (~214.11 / ~201.03 / ~183.78)
- 38.2% + gap fill (~201.03) confluence support zone
הערה
Note: TradingView chart was dividend adjusted (ADJ) when mapped.
פרסומים קשורים
כתב ויתור
המידע והפרסומים אינם מיועדים להיות, ואינם מהווים, ייעוץ או המלצה פיננסית, השקעתית, מסחרית או מכל סוג אחר המסופקת או מאושרת על ידי TradingView. קרא עוד ב־תנאי השימוש.
פרסומים קשורים
כתב ויתור
המידע והפרסומים אינם מיועדים להיות, ואינם מהווים, ייעוץ או המלצה פיננסית, השקעתית, מסחרית או מכל סוג אחר המסופקת או מאושרת על ידי TradingView. קרא עוד ב־תנאי השימוש.