
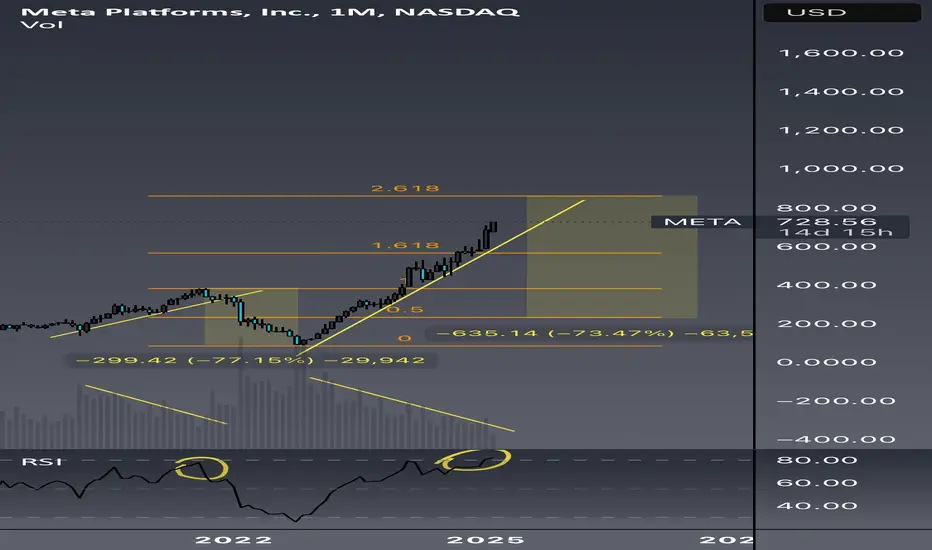
Just a little fun and brainstorming with higher time frame charts. Utilizing RSI, patterns, and time cycles.
Lots of similarities between now and the 2020-2021 bull run. Not to mention a lot of good data suggesting we are close to a recession at best. (Weak housing data/stocks, yield curve uninversion)
What are your thoughts?
Lots of similarities between now and the 2020-2021 bull run. Not to mention a lot of good data suggesting we are close to a recession at best. (Weak housing data/stocks, yield curve uninversion)
What are your thoughts?

כתב ויתור
המידע והפרסומים אינם מיועדים להיות, ואינם מהווים, ייעוץ או המלצה פיננסית, השקעתית, מסחרית או מכל סוג אחר המסופקת או מאושרת על ידי TradingView. קרא עוד ב־תנאי השימוש.
כתב ויתור
המידע והפרסומים אינם מיועדים להיות, ואינם מהווים, ייעוץ או המלצה פיננסית, השקעתית, מסחרית או מכל סוג אחר המסופקת או מאושרת על ידי TradingView. קרא עוד ב־תנאי השימוש.