
Microsoft (MSFT) – Daily Chart Analysis
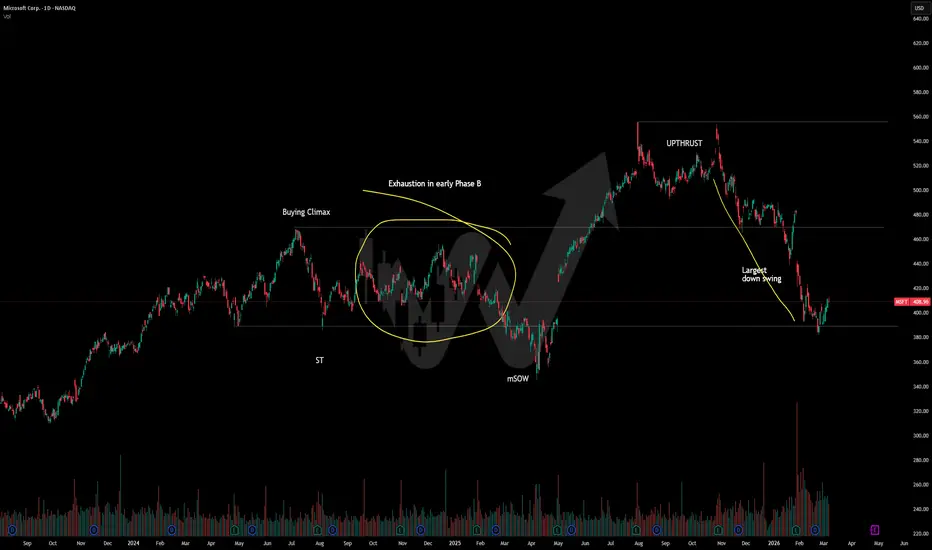
Microsoft has been trading within a large range since July 2024.
Key developments so far:
July 2024: Upthrust above resistance, followed by a Buying Climax and clear stopping action
Subsequent decline created an Automatic Reaction (AR) that acted as a Change of Character (CHOCH)
This signaled exhaustion of both buyers and sellers during Phase B of the range
August 2025: Another Upthrust above resistance occurred
Price spent time above the level before collapsing back down to support
The swift return to support may be interpreted as a minor Sign of Strength
Current situation
We are now closely monitoring price action at the lower boundary of the range (support).
Before considering any long positions, we would require:
Clear evidence of selling exhaustion
Visible signs of demand / absorption appearing at this level
As of now, demand remains insufficient to justify a long entry.
Patience is warranted—we need more confirmatory price and volume details before taking directional action.
Microsoft has been trading within a large range since July 2024.
Key developments so far:
July 2024: Upthrust above resistance, followed by a Buying Climax and clear stopping action
Subsequent decline created an Automatic Reaction (AR) that acted as a Change of Character (CHOCH)
This signaled exhaustion of both buyers and sellers during Phase B of the range
August 2025: Another Upthrust above resistance occurred
Price spent time above the level before collapsing back down to support
The swift return to support may be interpreted as a minor Sign of Strength
Current situation
We are now closely monitoring price action at the lower boundary of the range (support).
Before considering any long positions, we would require:
Clear evidence of selling exhaustion
Visible signs of demand / absorption appearing at this level
As of now, demand remains insufficient to justify a long entry.
Patience is warranted—we need more confirmatory price and volume details before taking directional action.
הערה
Are we exhausting supply ? Possible. We need so to some strength before any excitement to the up side but for now we're still monitoring the next swing down.עסקה פעילה
Weakness for now, still looking if sellers exhaust or not at Support הערה
As of now we're still weak. It may be due to the uncertainty we're going through right now. We may continue another leg down
כתב ויתור
המידע והפרסומים אינם מיועדים להיות, ואינם מהווים, ייעוץ או המלצה פיננסית, השקעתית, מסחרית או מכל סוג אחר המסופקת או מאושרת על ידי TradingView. קרא עוד ב־תנאי השימוש.
כתב ויתור
המידע והפרסומים אינם מיועדים להיות, ואינם מהווים, ייעוץ או המלצה פיננסית, השקעתית, מסחרית או מכל סוג אחר המסופקת או מאושרת על ידי TradingView. קרא עוד ב־תנאי השימוש.