
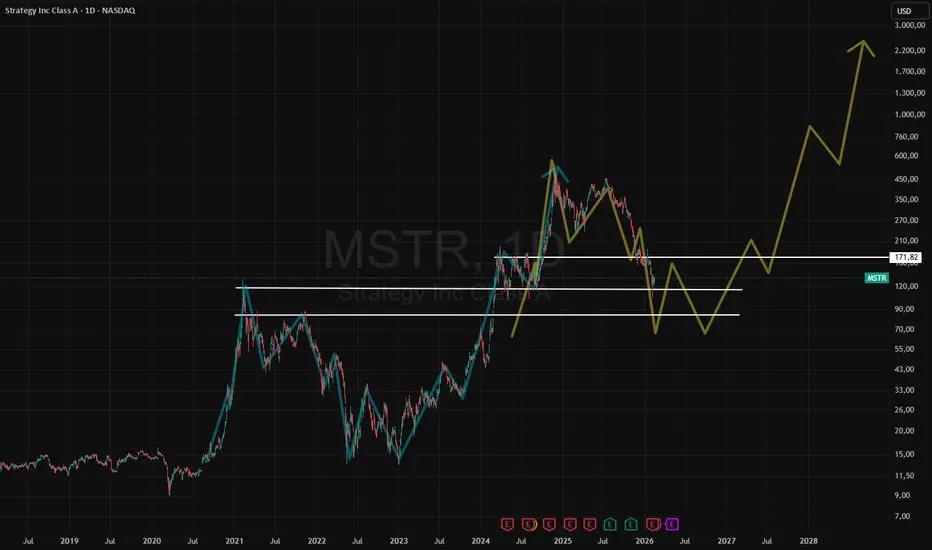
Current Price: ~US$134.79 (recent close).
Context: MSTR is strongly correlated to Bitcoin, acting as leverage for the digital asset.
Chart (log):
- Long-term trend is still bullish, but the price is correcting from the 2024-2025 highs.
- Historical support in the US$100-130 region (currently tested).
- Immediate resistance at US$150-170; a break above this could indicate a recovery.
SSR indicator (in the subchart):
- Apparent value of 0.62 (normalized SSR) → well below 1.0, indicating an excess of stablecoins relative to BTC.
- This signals high available purchasing power, historically preceding upward movements in Bitcoin.
Conclusion:
- The scenario is favorable for MSTR in the medium term, given the accumulation of liquidity (low SSR) and the price testing relevant support.
- Confirmation would come with a break above $150 and/or a recovery in Bitcoin.
Risk: Loss of support at $100 could extend the correction.
Context: MSTR is strongly correlated to Bitcoin, acting as leverage for the digital asset.
Chart (log):
- Long-term trend is still bullish, but the price is correcting from the 2024-2025 highs.
- Historical support in the US$100-130 region (currently tested).
- Immediate resistance at US$150-170; a break above this could indicate a recovery.
SSR indicator (in the subchart):
- Apparent value of 0.62 (normalized SSR) → well below 1.0, indicating an excess of stablecoins relative to BTC.
- This signals high available purchasing power, historically preceding upward movements in Bitcoin.
Conclusion:
- The scenario is favorable for MSTR in the medium term, given the accumulation of liquidity (low SSR) and the price testing relevant support.
- Confirmation would come with a break above $150 and/or a recovery in Bitcoin.
Risk: Loss of support at $100 could extend the correction.

כתב ויתור
המידע והפרסומים אינם מיועדים להיות, ואינם מהווים, ייעוץ או המלצה פיננסית, השקעתית, מסחרית או מכל סוג אחר המסופקת או מאושרת על ידי TradingView. קרא עוד ב־תנאי השימוש.
כתב ויתור
המידע והפרסומים אינם מיועדים להיות, ואינם מהווים, ייעוץ או המלצה פיננסית, השקעתית, מסחרית או מכל סוג אחר המסופקת או מאושרת על ידי TradingView. קרא עוד ב־תנאי השימוש.