
USNAS100 – Overview
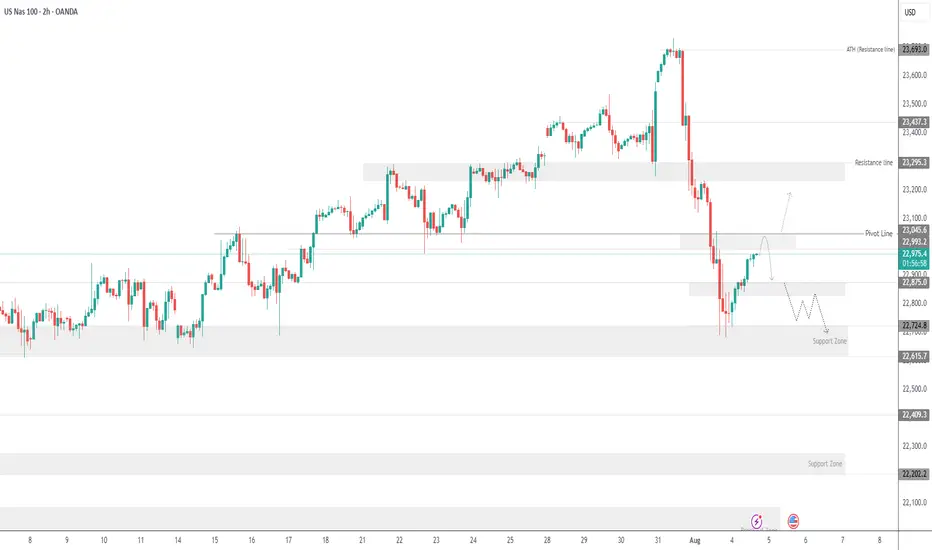
The index maintains a bearish momentum as long as it trades below the pivot zone between 22990 and 23045.
To confirm a bullish reversal, the price must break above 23045 and close a 1H candle above it.
On the downside, a break below 22875 would reinforce bearish pressure, opening the path toward the next support at 22720.
Support: 22875 • 22720
Resistance: 23150 • 23295
Bias:
🔻 Bearish below 23045
🔺 Bullish only with a confirmed 1H close above 23045
The index maintains a bearish momentum as long as it trades below the pivot zone between 22990 and 23045.
To confirm a bullish reversal, the price must break above 23045 and close a 1H candle above it.
On the downside, a break below 22875 would reinforce bearish pressure, opening the path toward the next support at 22720.
Support: 22875 • 22720
Resistance: 23150 • 23295
Bias:
🔻 Bearish below 23045
🔺 Bullish only with a confirmed 1H close above 23045

Technical & Macro Market Analyst specializing in Gold, U.S. Indices, and Forex.
Providing regular updates with structure, entry/exit clarity, and real-time outlooks.
Providing regular updates with structure, entry/exit clarity, and real-time outlooks.
פרסומים קשורים
כתב ויתור
המידע והפרסומים אינם מיועדים להיות, ואינם מהווים, ייעוץ או המלצה פיננסית, השקעתית, מסחרית או מכל סוג אחר המסופקת או מאושרת על ידי TradingView. קרא עוד ב־תנאי השימוש.
Technical & Macro Market Analyst specializing in Gold, U.S. Indices, and Forex.
Providing regular updates with structure, entry/exit clarity, and real-time outlooks.
Providing regular updates with structure, entry/exit clarity, and real-time outlooks.
פרסומים קשורים
כתב ויתור
המידע והפרסומים אינם מיועדים להיות, ואינם מהווים, ייעוץ או המלצה פיננסית, השקעתית, מסחרית או מכל סוג אחר המסופקת או מאושרת על ידי TradingView. קרא עוד ב־תנאי השימוש.