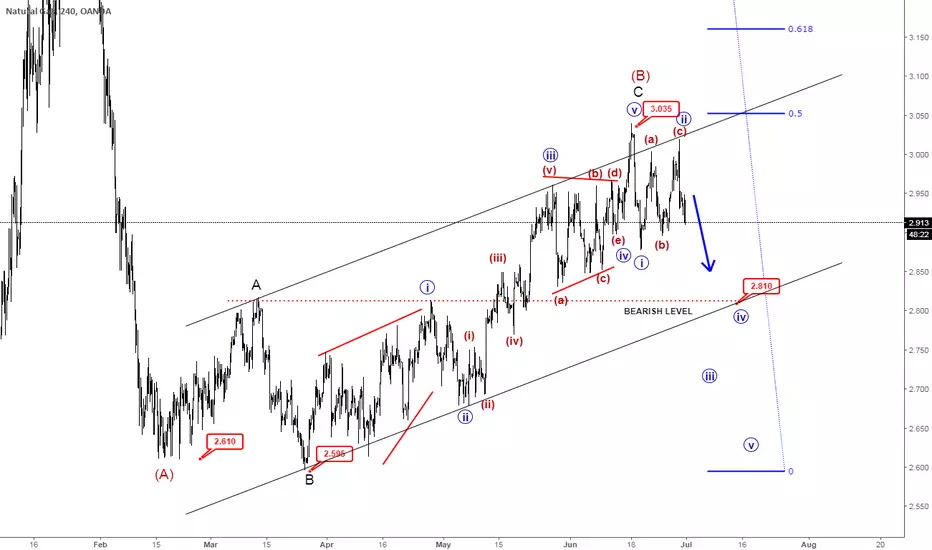
 NATGASUSD dropped sharply in the beginning of February and then we have seen slow and sideways corrective movement within channel range for the last 5 months, clearly in three waves, which might finally found resistance around 50% Fibonacci retracement just above 3.0 level.
Current price action on a smaller time frame looks like it's forming a clear bearish setup, so be aware of more weakness here. Actually, it can be very impulsive and it can be headed back to 2.6 lows or maybe even lower, especially if we get a confirmation, which would be a break below channel support line and 2.81 level.
Even if we get something more complex here, we remain bearish as long as it's trading below 3.035 highs, which is our invalidation level.
Disclosure: Please be informed that information we provide is NOT a trading recommendation or investment advice. All of our work is for educational purposes only.
הערה
As we mentioned, clear bullish setup on a smaller time frame (Hourly chart):הערה
Clear Bearish Setupהערה
As expected, Natural Gas breaking lower, more to come?הערה
Natural Gas keeps moving lower and there's room for more after a pullback.
Join the community for one week, full access. Its free >> @ wavetraders.com/elliott-wave-plans/
Learn Elliott Waves Sale-65%
👉 wavetraders.com/academy/
Newsletter
👉 bit.ly/3FVPVzO
Learn Elliott Waves Sale-65%
👉 wavetraders.com/academy/
Newsletter
👉 bit.ly/3FVPVzO
כתב ויתור
המידע והפרסומים אינם מיועדים להיות, ואינם מהווים, ייעוץ או המלצה פיננסית, השקעתית, מסחרית או מכל סוג אחר המסופקת או מאושרת על ידי TradingView. קרא עוד ב־תנאי השימוש.
Join the community for one week, full access. Its free >> @ wavetraders.com/elliott-wave-plans/
Learn Elliott Waves Sale-65%
👉 wavetraders.com/academy/
Newsletter
👉 bit.ly/3FVPVzO
Learn Elliott Waves Sale-65%
👉 wavetraders.com/academy/
Newsletter
👉 bit.ly/3FVPVzO
כתב ויתור
המידע והפרסומים אינם מיועדים להיות, ואינם מהווים, ייעוץ או המלצה פיננסית, השקעתית, מסחרית או מכל סוג אחר המסופקת או מאושרת על ידי TradingView. קרא עוד ב־תנאי השימוש.