
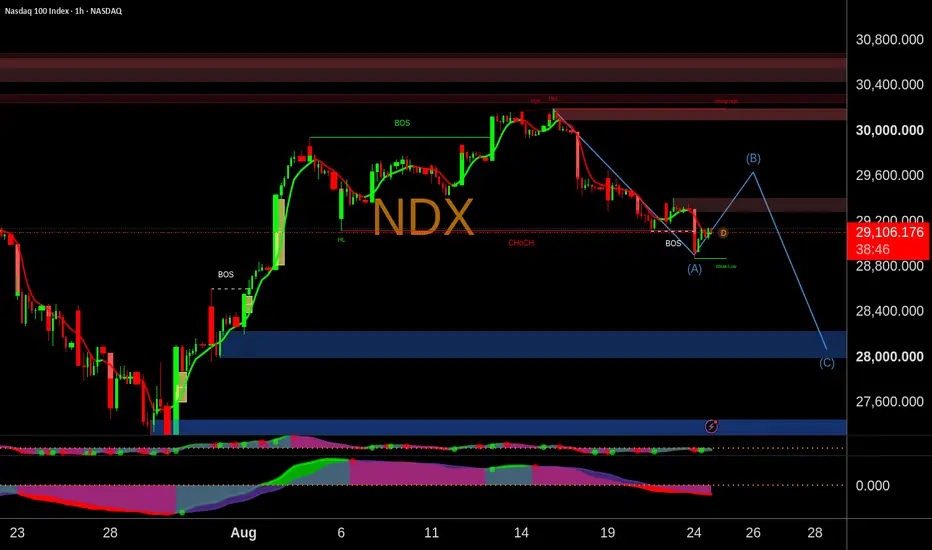
The Nasdaq 100 Index (NDX) on the 1-hour timeframe has delivered a definitive Change of Character (ChoCH) to the downside, breaking past local support to form a fresh short-term bearish market structure. After peaking near the 30,191 level, price action aggressively sold off to establish a weak low at Point A around 28,904. Current price action is consolidating near 29,141, signaling a classic market setup defined by standard lower lows and lower highs.
The Structural Roadmap
The primary projection targets a pullback rally toward Point B, but it is crucial to understand that this location is highly subjective. Rather than a hard-and-fast line in the sand, the Point B region around 29,636 represents a broader retracement zone where we expect the next lower high to form. A successful rejection anywhere within this general supply zone sets the stage for a continuation move down to Point C, targeting the key demand area near 28,073.
Actionable Trade Approaches
Traders looking to capitalize on this price path have a few distinct tactical setups depending on risk profile.
As price explores the subjective Point B rally zone near 29,636, a Bear Call Credit Spread above the recent highs allows you to collect premium while establishing a high-probability capped-risk entry.
For traders seeking maximum leverage on the downward expansion, buying Directional Puts upon confirmation of a rejection in the Point B zone offers direct exposure down toward the Point C target.
Once price reaches the major blue demand zone at Point C around 28,073, selling a Put Credit Spread allows you to take advantage of peak implied volatility and position for a structural bounce off support.
Track these price zones closely to confirm acceptance before taking execution risk.
The Structural Roadmap
The primary projection targets a pullback rally toward Point B, but it is crucial to understand that this location is highly subjective. Rather than a hard-and-fast line in the sand, the Point B region around 29,636 represents a broader retracement zone where we expect the next lower high to form. A successful rejection anywhere within this general supply zone sets the stage for a continuation move down to Point C, targeting the key demand area near 28,073.
Actionable Trade Approaches
Traders looking to capitalize on this price path have a few distinct tactical setups depending on risk profile.
As price explores the subjective Point B rally zone near 29,636, a Bear Call Credit Spread above the recent highs allows you to collect premium while establishing a high-probability capped-risk entry.
For traders seeking maximum leverage on the downward expansion, buying Directional Puts upon confirmation of a rejection in the Point B zone offers direct exposure down toward the Point C target.
Once price reaches the major blue demand zone at Point C around 28,073, selling a Put Credit Spread allows you to take advantage of peak implied volatility and position for a structural bounce off support.
Track these price zones closely to confirm acceptance before taking execution risk.

Money_Mentors
כתב ויתור
המידע והפרסומים אינם מיועדים להיות, ואינם מהווים, ייעוץ או המלצה פיננסית, השקעתית, מסחרית או מכל סוג אחר המסופקת או מאושרת על ידי TradingView. קרא עוד ב־תנאי השימוש.
Money_Mentors
כתב ויתור
המידע והפרסומים אינם מיועדים להיות, ואינם מהווים, ייעוץ או המלצה פיננסית, השקעתית, מסחרית או מכל סוג אחר המסופקת או מאושרת על ידי TradingView. קרא עוד ב־תנאי השימוש.