
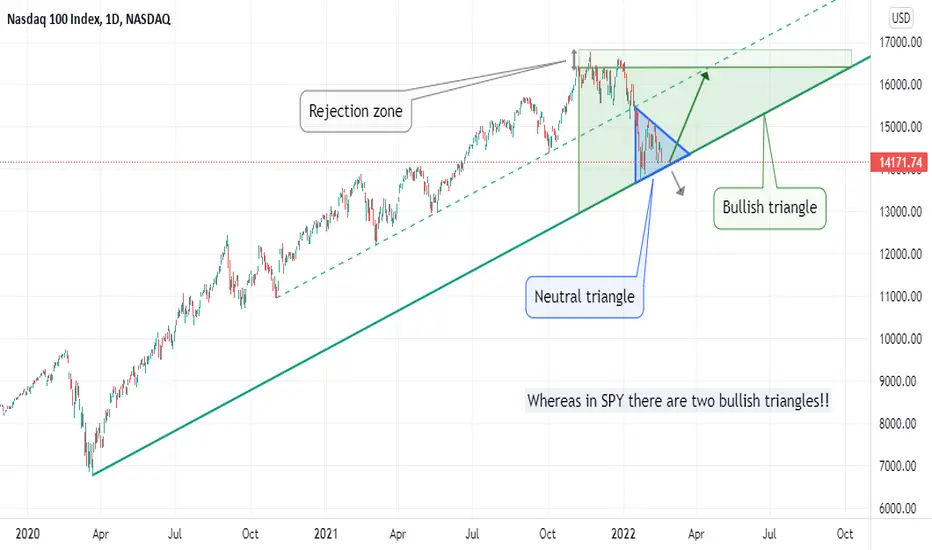
For the Nasdaq100 and S&P500 !!

Huge risk / reward if it goes to the rejection zone.
Btw I'm thinking to sell only when my technical indicators will turned bearish, and not at a fixed price.
There is a risk of the Nasdaq symmetrical triangle pattern leads to a break trough the support.
Be careful to disable your buy orders during the pre and post-market, a breakaway gap could easily invalidate these patterns.
Idea to be used with your favourites technical indicators (Squeeze momentum indicator [LazyBear], MACD etc...).
I will set a BUY LMT at +0.40% over the support and a SELL STP at -0.25%
For beginners: give a look to courses (investopedia or tradingview) about triangle pattern: descending triangle pattern, ascending triangle pattern and symmetrical triangle pattern .
Huge risk / reward if it goes to the rejection zone.
Btw I'm thinking to sell only when my technical indicators will turned bearish, and not at a fixed price.
There is a risk of the Nasdaq symmetrical triangle pattern leads to a break trough the support.
Be careful to disable your buy orders during the pre and post-market, a breakaway gap could easily invalidate these patterns.
Idea to be used with your favourites technical indicators (Squeeze momentum indicator [LazyBear], MACD etc...).
I will set a BUY LMT at +0.40% over the support and a SELL STP at -0.25%
For beginners: give a look to courses (investopedia or tradingview) about triangle pattern: descending triangle pattern, ascending triangle pattern and symmetrical triangle pattern .

כתב ויתור
המידע והפרסומים אינם מיועדים להיות, ואינם מהווים, ייעוץ או המלצה פיננסית, השקעתית, מסחרית או מכל סוג אחר המסופקת או מאושרת על ידי TradingView. קרא עוד ב־תנאי השימוש.
כתב ויתור
המידע והפרסומים אינם מיועדים להיות, ואינם מהווים, ייעוץ או המלצה פיננסית, השקעתית, מסחרית או מכל סוג אחר המסופקת או מאושרת על ידי TradingView. קרא עוד ב־תנאי השימוש.