
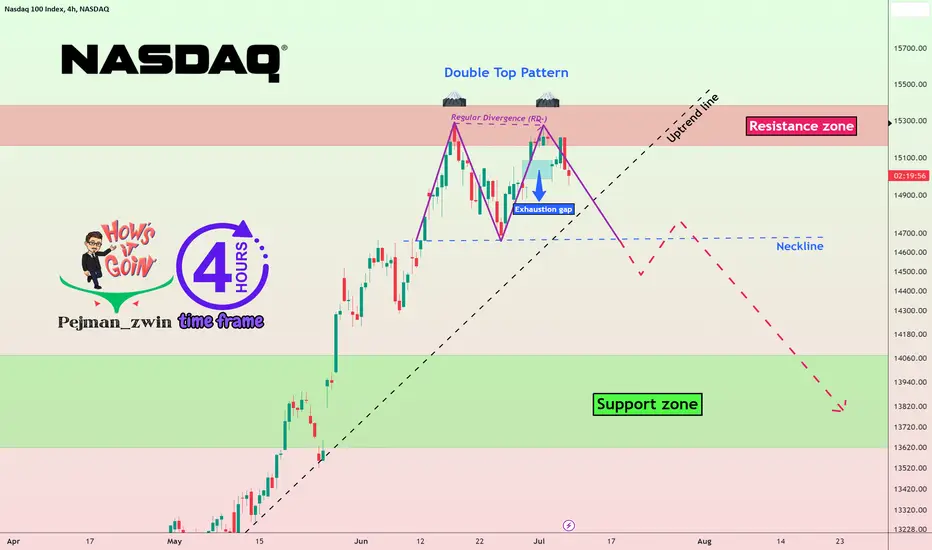
Nasdaq is moving near the 🔴resistance zone(15,385-$15,160)🔴, and the formation of an Exhaustion gap can be a 💡Sign💡 of the end of the upward trend of the Nasdaq these few weeks.
Also, due to the Regular Divergence(RD-) between two consecutive peaks, the possibility of forming a 🗻Double Top pattern🗻 is very high.
🔔I expect the Nasdaq to fall to at least the 🟢support zone($ 14,060-$ 13,610)🟢 after breaking the uptrend line and neckline.
Nasdaq 100 Index Analyze (NDXUSD), 4-hour time frame⏰.
Do not forget to put Stop loss for your positions (For every position that you want to open).
Please follow your strategy, this is just my Idea, and I will be glad to see your ideas in this post.
Please do not forget the ✅' like'✅ button 🙏😊 & Share it with your friends; thanks, and Trade safe.
Also, due to the Regular Divergence(RD-) between two consecutive peaks, the possibility of forming a 🗻Double Top pattern🗻 is very high.
🔔I expect the Nasdaq to fall to at least the 🟢support zone($ 14,060-$ 13,610)🟢 after breaking the uptrend line and neckline.
Nasdaq 100 Index Analyze (NDXUSD), 4-hour time frame⏰.
Do not forget to put Stop loss for your positions (For every position that you want to open).
Please follow your strategy, this is just my Idea, and I will be glad to see your ideas in this post.
Please do not forget the ✅' like'✅ button 🙏😊 & Share it with your friends; thanks, and Trade safe.
עסקה פעילה

ProTrader365 | Crypto & Forex Analyst
8+ Years Experience • Elliott Wave • Volume & Order Flow
Free Signals, Market Analysis & Education
Explore our community & VIP services:
linktr.ee/ProTrader365
8+ Years Experience • Elliott Wave • Volume & Order Flow
Free Signals, Market Analysis & Education
Explore our community & VIP services:
linktr.ee/ProTrader365
כתב ויתור
המידע והפרסומים אינם מיועדים להיות, ואינם מהווים, ייעוץ או המלצה פיננסית, השקעתית, מסחרית או מכל סוג אחר המסופקת או מאושרת על ידי TradingView. קרא עוד ב־תנאי השימוש.
ProTrader365 | Crypto & Forex Analyst
8+ Years Experience • Elliott Wave • Volume & Order Flow
Free Signals, Market Analysis & Education
Explore our community & VIP services:
linktr.ee/ProTrader365
8+ Years Experience • Elliott Wave • Volume & Order Flow
Free Signals, Market Analysis & Education
Explore our community & VIP services:
linktr.ee/ProTrader365
כתב ויתור
המידע והפרסומים אינם מיועדים להיות, ואינם מהווים, ייעוץ או המלצה פיננסית, השקעתית, מסחרית או מכל סוג אחר המסופקת או מאושרת על ידי TradingView. קרא עוד ב־תנאי השימוש.