לונג
NEOUSD 4h long setup
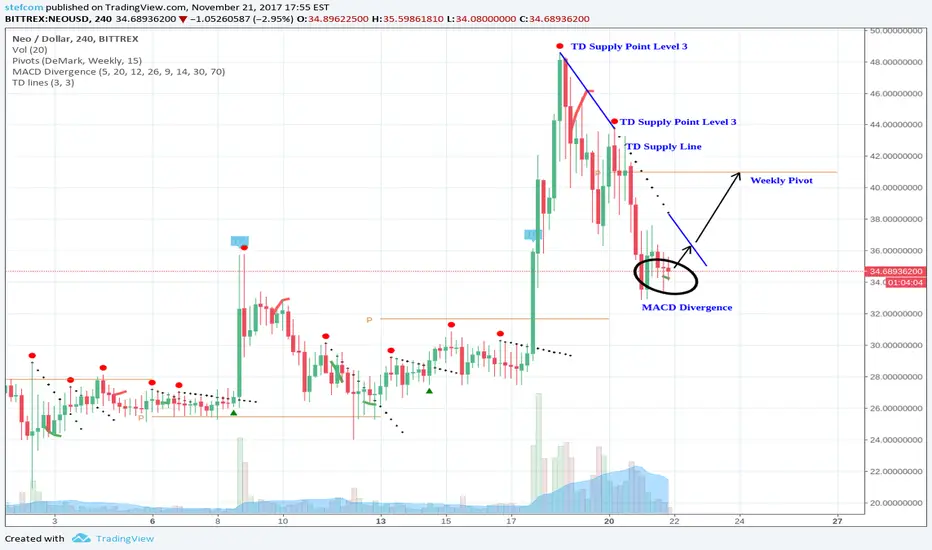
The NEOUSD 4h chart shows a Divergence of Price vs the MACD histogram.
The divergence appeared below a TD Supply Line and could indicate a trend-reversal.
When price breaks the TD Supply Line it could go up to the weekly pivot.
The divergence appeared below a TD Supply Line and could indicate a trend-reversal.
When price breaks the TD Supply Line it could go up to the weekly pivot.

⚡ Signals & Indicator & Strategy & Daily/ Weekly VIP Briefings: tradingclue.com/
⚡ GET THE CCIDivergence INDICATOR FOR FREE: bit.ly/FreeTradingViewIndicator
⚡ FREE Daily Briefings via Telegram: t.me/TradingClueBriefings
⚡ GET THE CCIDivergence INDICATOR FOR FREE: bit.ly/FreeTradingViewIndicator
⚡ FREE Daily Briefings via Telegram: t.me/TradingClueBriefings
פרסומים קשורים
כתב ויתור
המידע והפרסומים אינם מיועדים להיות, ואינם מהווים, ייעוץ או המלצה פיננסית, השקעתית, מסחרית או מכל סוג אחר המסופקת או מאושרת על ידי TradingView. קרא עוד ב־תנאי השימוש.