NEO - nice chart
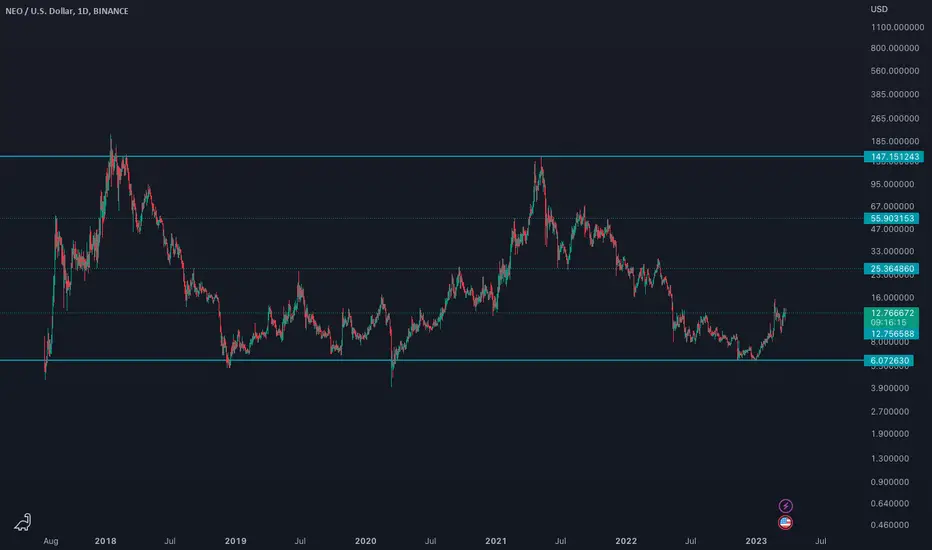
The NEO chart, very nice how it moved in 5 years between a very strong support and resistance and 3 other lines that were alternately when support, when resistance. Of course, on the 1D timeframe. What will NEO do next? We follow his evolution. Now everything seems simpler and it seems easier to identify a bottom or a top.

כתב ויתור
המידע והפרסומים אינם מיועדים להיות, ואינם מהווים, ייעוץ או המלצה פיננסית, השקעתית, מסחרית או מכל סוג אחר המסופקת או מאושרת על ידי TradingView. קרא עוד ב־תנאי השימוש.
כתב ויתור
המידע והפרסומים אינם מיועדים להיות, ואינם מהווים, ייעוץ או המלצה פיננסית, השקעתית, מסחרית או מכל סוג אחר המסופקת או מאושרת על ידי TradingView. קרא עוד ב־תנאי השימוש.