
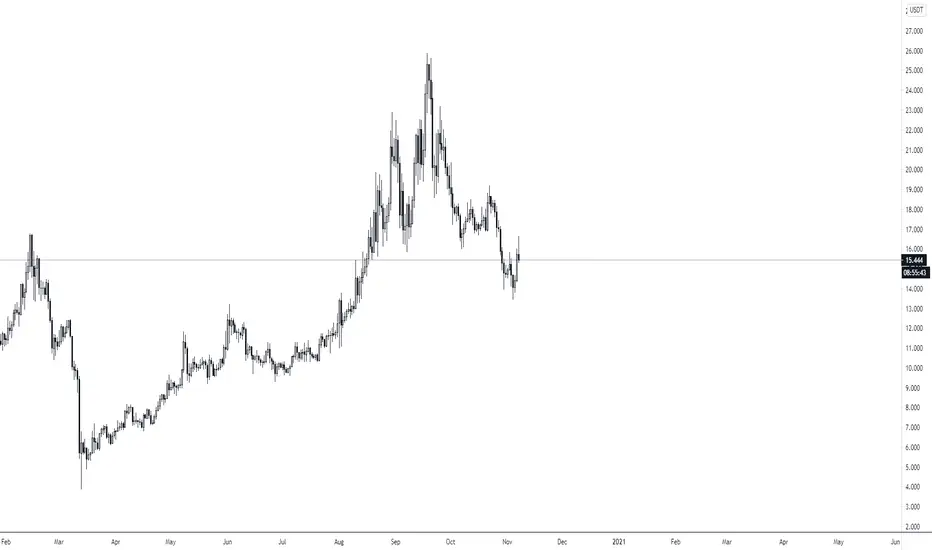
TOP DOWN ANALYSIS ON NEOUSDT
הערה
On the daily timeframe, market has been on a strong bullish run since March till date. Again, we can also see two respected support and resistance zones accompanied by a head and shoulder formation which price had broken the neckline and currently in for a retest.
הערה
On a 4 hour timeframe, we can spot the down trending channel. The small red zone that has been marked out is an obvious fake out. Price is currently at resistance of the channel which is also the confirmed resistance zone.
הערה
Evidences on daily and 4 hour timeframe proves that the odds that the market will be bearish on a long term is much higher. However, it is very important to make sure you manage your risks on whatever trading decisions you intent to make with live funds.
פרסומים קשורים
כתב ויתור
המידע והפרסומים אינם מיועדים להיות, ואינם מהווים, ייעוץ או המלצה פיננסית, השקעתית, מסחרית או מכל סוג אחר המסופקת או מאושרת על ידי TradingView. קרא עוד ב־תנאי השימוש.
כתב ויתור
המידע והפרסומים אינם מיועדים להיות, ואינם מהווים, ייעוץ או המלצה פיננסית, השקעתית, מסחרית או מכל סוג אחר המסופקת או מאושרת על ידי TradingView. קרא עוד ב־תנאי השימוש.