
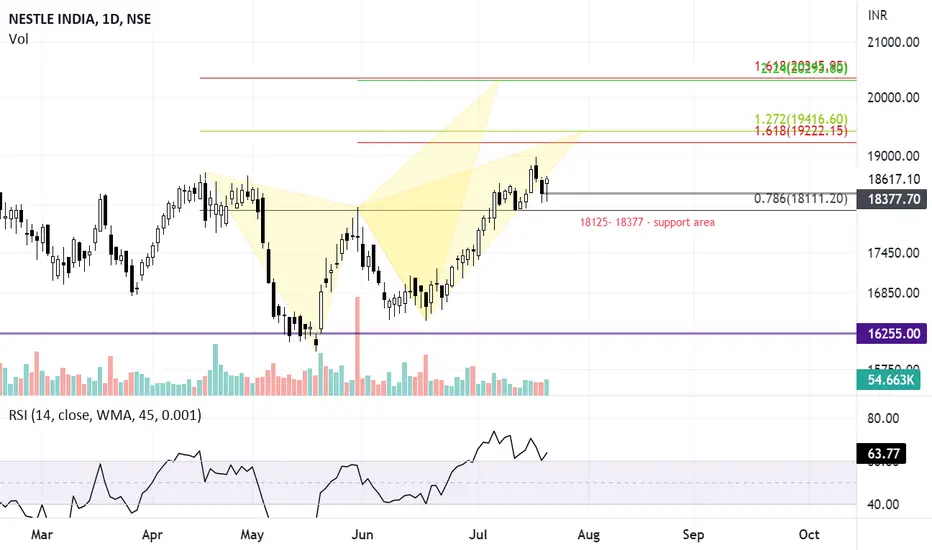
There is a probability of a butterfly pattern on the daily chart of NestleIndia.
Sustaining 18100, the stock might move towards 19200- 19400 in the coming sessions initially and then towards 20300-20350 levels.
Sustaining 18100, the stock might move towards 19200- 19400 in the coming sessions initially and then towards 20300-20350 levels.

כתב ויתור
המידע והפרסומים אינם מיועדים להיות, ואינם מהווים, ייעוץ או המלצה פיננסית, השקעתית, מסחרית או מכל סוג אחר המסופקת או מאושרת על ידי TradingView. קרא עוד ב־תנאי השימוש.
כתב ויתור
המידע והפרסומים אינם מיועדים להיות, ואינם מהווים, ייעוץ או המלצה פיננסית, השקעתית, מסחרית או מכל סוג אחר המסופקת או מאושרת על ידי TradingView. קרא עוד ב־תנאי השימוש.