
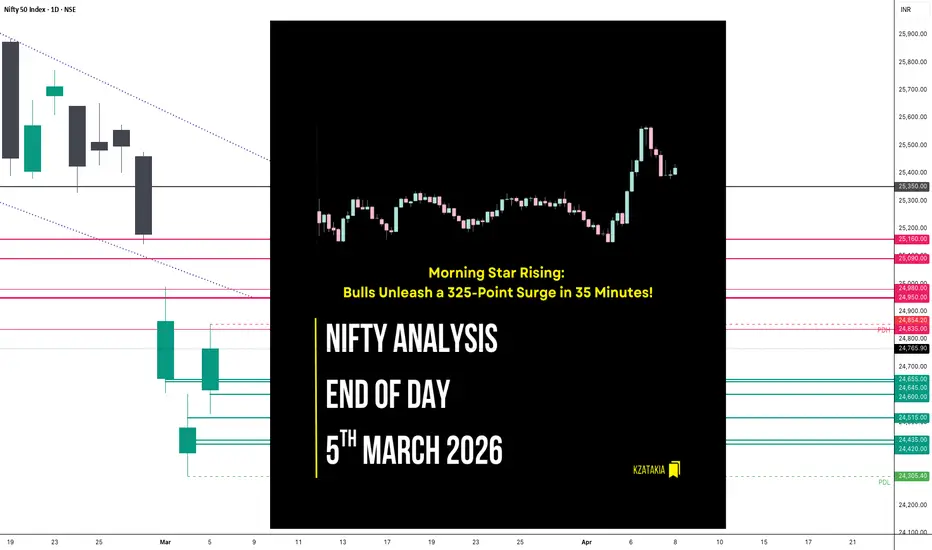
🟢 Nifty Analysis EOD – March 5, 2026 – Thursday 🔴
Morning Star Rising: Bulls Unleash a 325-Point Surge in 35 Minutes!
🗞 Nifty Summary
The Nifty started the day with a strong 143-point Gap Up. After an initial 35-point rise, the index dipped 122 points to complete the gap-filling process, establishing an Initial Balance (IB) range of 24,530 ~ 24,656. For most of the day, the market remained in a dull, range-bound state.
However, the true fireworks began at 2:15 PM. After testing the IBL, Nifty launched an explosive 325-point vertical rally in just 35 minutes, marking a day high of 24,854. In typical volatile fashion, the index surrendered 150 points from the peak around 3:00 PM to end the day at 24,737.45 (Adjusted close: 24,765.90), gaining +285.40 points (+1.17%).
Evaluating the last three sessions, the daily time frame is now forming a Morning Star candlestick pattern, which is a classic bullish reversal signal.
For the upcoming session, the opening price will be the most important factor. The 24,950 ~ 24,980 zone stands as a major resistance, while bulls need to sustain above 24,515 ~ 24,480 to continue building a base. This 500-point range will be the crucial battlefield tomorrow.
🛡 5 Min Intraday Chart with Levels

📉 Daily Time Frame Chart with Intraday Levels

🕯 Daily Candle Breakdown
Open: 24,615.95
High: 24,854.20
Low: 24,529.40
Close: 24,765.90
Change: +285.40 (+1.17%)
🏗️ Structure Breakdown
Type: Bullish candle with balanced wicks.
Range: ≈ 325 points — Very high volatility.
Body: ≈ 150 points — Strong bullish real body.
Upper Wick: ≈ 88 points — Profit booking seen after the 2:15 PM spike.
Lower Wick: ≈ 86 points — Successful gap-fill and defense of lower levels.
🛡 5 Min Intraday Chart

⚔️ Gladiator Strategy Update
ATR: 345.19
IB Range: 126.65 → Medium
Market Structure: Imbalanced
Trade Highlights:
13:41 Short Trade: Trailing SL Hit (Contra trade attempted at IBH rejection).
14:38 Long Trade: Target Hit (R:R 1:2.61) (Pattern + IBH Breakout).
Trade Summary:
Today required patience during the long sideways grind. I attempted a short trade at 1:41 PM which didn’t go far and hit the trailing stop. However, the system caught the massive afternoon expansion at 2:38 PM. Waiting for that confirmed IBH breakout was the right move, yielding a solid 1:2.61 reward as the market went into “beast mode.”
🧱 Support & Resistance Levels
Resistance Zones: 24,835 | 24,950 ~ 24,980
Support Zones: 24,655 ~ 24,645 | 24,600 | 24,515 | 24,435 ~ 24,420
🧠 Final Thoughts
“The Morning Star is shining, but the path ahead has hurdles.”
The reversal pattern on the daily chart is encouraging, but we cannot ignore the sharp 150-point drop at the end of the day. It shows that bears are still ready to sell at higher levels.
Tomorrow will likely be a volatile tug-of-war within the 500-point zone I mentioned. I will stay practical: let the IB form, watch the 24,835 level, and only trade when the structure is clear. Discipline over excitement.
✏️ Disclaimer
This is my personal digital diary and represents my own analysis and point of view. It is not financial advice; please consult a professional advisor before making any trading decisions.
Morning Star Rising: Bulls Unleash a 325-Point Surge in 35 Minutes!
🗞 Nifty Summary
The Nifty started the day with a strong 143-point Gap Up. After an initial 35-point rise, the index dipped 122 points to complete the gap-filling process, establishing an Initial Balance (IB) range of 24,530 ~ 24,656. For most of the day, the market remained in a dull, range-bound state.
However, the true fireworks began at 2:15 PM. After testing the IBL, Nifty launched an explosive 325-point vertical rally in just 35 minutes, marking a day high of 24,854. In typical volatile fashion, the index surrendered 150 points from the peak around 3:00 PM to end the day at 24,737.45 (Adjusted close: 24,765.90), gaining +285.40 points (+1.17%).
Evaluating the last three sessions, the daily time frame is now forming a Morning Star candlestick pattern, which is a classic bullish reversal signal.
For the upcoming session, the opening price will be the most important factor. The 24,950 ~ 24,980 zone stands as a major resistance, while bulls need to sustain above 24,515 ~ 24,480 to continue building a base. This 500-point range will be the crucial battlefield tomorrow.
🛡 5 Min Intraday Chart with Levels
📉 Daily Time Frame Chart with Intraday Levels
🕯 Daily Candle Breakdown
Open: 24,615.95
High: 24,854.20
Low: 24,529.40
Close: 24,765.90
Change: +285.40 (+1.17%)
🏗️ Structure Breakdown
Type: Bullish candle with balanced wicks.
Range: ≈ 325 points — Very high volatility.
Body: ≈ 150 points — Strong bullish real body.
Upper Wick: ≈ 88 points — Profit booking seen after the 2:15 PM spike.
Lower Wick: ≈ 86 points — Successful gap-fill and defense of lower levels.
🛡 5 Min Intraday Chart
⚔️ Gladiator Strategy Update
ATR: 345.19
IB Range: 126.65 → Medium
Market Structure: Imbalanced
Trade Highlights:
13:41 Short Trade: Trailing SL Hit (Contra trade attempted at IBH rejection).
14:38 Long Trade: Target Hit (R:R 1:2.61) (Pattern + IBH Breakout).
Trade Summary:
Today required patience during the long sideways grind. I attempted a short trade at 1:41 PM which didn’t go far and hit the trailing stop. However, the system caught the massive afternoon expansion at 2:38 PM. Waiting for that confirmed IBH breakout was the right move, yielding a solid 1:2.61 reward as the market went into “beast mode.”
🧱 Support & Resistance Levels
Resistance Zones: 24,835 | 24,950 ~ 24,980
Support Zones: 24,655 ~ 24,645 | 24,600 | 24,515 | 24,435 ~ 24,420
🧠 Final Thoughts
“The Morning Star is shining, but the path ahead has hurdles.”
The reversal pattern on the daily chart is encouraging, but we cannot ignore the sharp 150-point drop at the end of the day. It shows that bears are still ready to sell at higher levels.
Tomorrow will likely be a volatile tug-of-war within the 500-point zone I mentioned. I will stay practical: let the IB form, watch the 24,835 level, and only trade when the structure is clear. Discipline over excitement.
✏️ Disclaimer
This is my personal digital diary and represents my own analysis and point of view. It is not financial advice; please consult a professional advisor before making any trading decisions.

Read my blogs here:
substack.com/@kzatakia
Follow me on Telegram:
t.me/swingtraderhub
Follow me on X:
x.com/kzatakia
substack.com/@kzatakia
Follow me on Telegram:
t.me/swingtraderhub
Follow me on X:
x.com/kzatakia
פרסומים קשורים
כתב ויתור
המידע והפרסומים אינם מיועדים להיות, ואינם מהווים, ייעוץ או המלצה פיננסית, השקעתית, מסחרית או מכל סוג אחר המסופקת או מאושרת על ידי TradingView. קרא עוד ב־תנאי השימוש.
Read my blogs here:
substack.com/@kzatakia
Follow me on Telegram:
t.me/swingtraderhub
Follow me on X:
x.com/kzatakia
substack.com/@kzatakia
Follow me on Telegram:
t.me/swingtraderhub
Follow me on X:
x.com/kzatakia
פרסומים קשורים
כתב ויתור
המידע והפרסומים אינם מיועדים להיות, ואינם מהווים, ייעוץ או המלצה פיננסית, השקעתית, מסחרית או מכל סוג אחר המסופקת או מאושרת על ידי TradingView. קרא עוד ב־תנאי השימוש.