
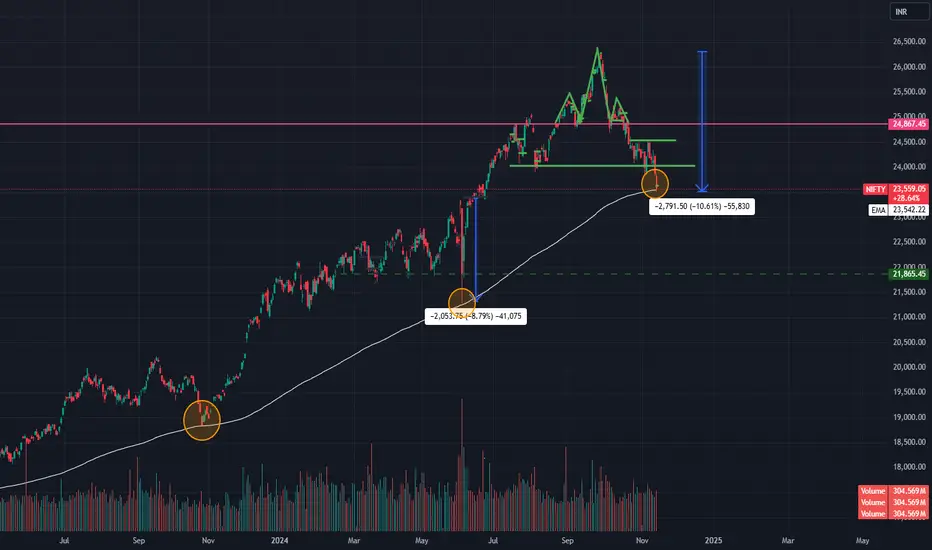
"In recent days, Nifty has formed a bearish head and shoulder pattern, indicating potential downside. It has currently reached 26,277.34, which is approximately 10.50% below its previous high. The 23,500 level is a crucial support zone, coinciding with the 200-day Exponential Moving Average (EMA). Historically, Nifty has tended to bounce off this 200-EMA.
However, it's important to note that market sentiment has turned bearish. Therefore, a prudent strategy would be to adopt a cautious approach, considering selling into rallies until we receive clear signs of upward momentum."
However, it's important to note that market sentiment has turned bearish. Therefore, a prudent strategy would be to adopt a cautious approach, considering selling into rallies until we receive clear signs of upward momentum."

כתב ויתור
המידע והפרסומים אינם מיועדים להיות, ואינם מהווים, ייעוץ או המלצה פיננסית, השקעתית, מסחרית או מכל סוג אחר המסופקת או מאושרת על ידי TradingView. קרא עוד ב־תנאי השימוש.
כתב ויתור
המידע והפרסומים אינם מיועדים להיות, ואינם מהווים, ייעוץ או המלצה פיננסית, השקעתית, מסחרית או מכל סוג אחר המסופקת או מאושרת על ידי TradingView. קרא עוד ב־תנאי השימוש.