
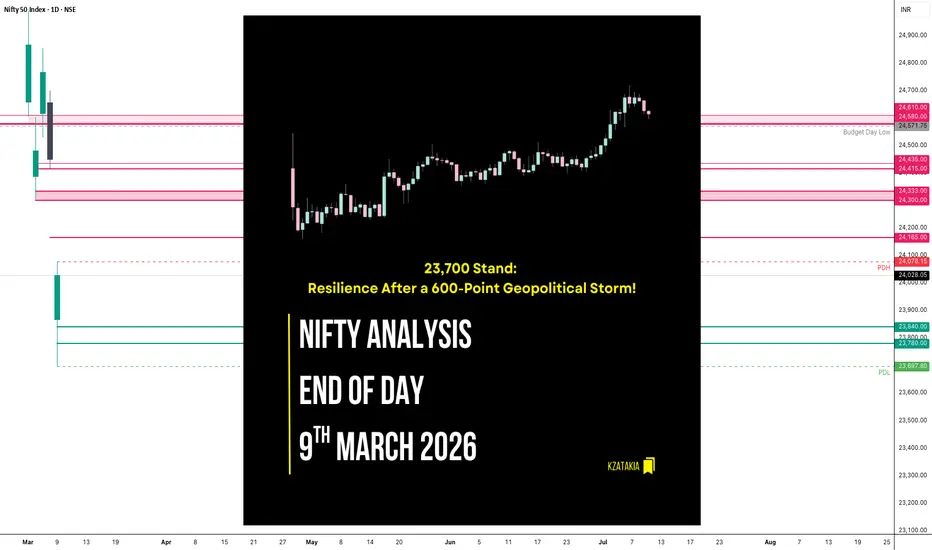
🟢 Nifty Analysis EOD – March 9, 2026 – Monday 🔴
23,700 Stand: Resilience After a 600-Point Geopolitical Storm!
🗞 Nifty Summary
Driven by negative global sentiment, geopolitical turmoil, and a surge in crude prices, the Nifty faced a staggering 600-point Gap Down today. The initial minutes saw an 88-point recovery attempt, but the pressure was too great, causing a deep 262-point plunge from the morning high to mark a day low at 23,697.80 (23,700).
This level acted as a rock-solid floor. From here, Nifty began a slow, steady, and disciplined climb toward the Initial Balance High (IBH). After multiple failed attempts to break the ceiling, the bulls finally succeeded around 2:40 PM, reclaiming the day high at 24,078.
The index eventually ended the session at 24,007.60 (Adjusted close: 24,028.05), losing -422.40 points (-1.73%). While the net change remains deeply in the red, the intraday structure tells a story of extreme resilience, with bulls absorbing a massive amount of selling pressure from the morning lows.
The volatility was mirrored in the oil markets; Brent Crude hit a high of 113.73 before losing 10 dollars mid-session. This kind of wild reaction is likely to persist in our markets for the upcoming sessions.
On the Daily time frame, despite the gap, we see a strong bullish recovery body, suggesting that buyers are finding value even in this environment of fear.
🛡 5 Min Intraday Chart with Levels

📉 Daily Time Frame Chart with Intraday Levels

🕯 Daily Candle Breakdown
Open: 23,868.05
High: 24,078.15
Low: 23,697.80
Close: 24,028.05
Change: -422.40 (-1.73%)
🏗️ Structure Breakdown
Type: Strong Bullish Candle (Intraday Recovery).
Range: ≈ 380 points — Very high volatility.
Body: ≈ 160 points — Solid bullish real body after the open.
Upper Wick: ≈ 50 points — Minor resistance encountered near the day’s peak.
Lower Wick: ≈ 170 points — Aggressive buying rejection from the 23,700 base.
🛡 5 Min Intraday Chart

⚔️ Gladiator Strategy Update
ATR: 386.38
IB Range: 261.90 → Medium (Relative to current volatility)
Market Structure: Imbalanced
Trade Highlights:
No Trade Day
Trade Summary: I chose to stay away from the trade terminal and be a spectator today. The combination of a massive opening gap and extreme geopolitical uncertainty made the directional bias very low-conviction. As a conservative trader, I prefer capital protection over chasing wild moves. When stop-losses are 2-3x wider than normal due to high ATR, even a winning trade can be stressful. Technical analysis is often less effective when a single headline or tweet can override every support and resistance level.
🧱 Support & Resistance Levels
Resistance Zones: 24,080 | 24,165 | 24,300 ~ 24,333
Support Zones: 23,840 | 23,780 | 23,700 (New Floor)
🧠 Final Thoughts
“Protecting capital is the only trade worth making in a war zone.”
With weekly expiry approaching and no signs of peace on the war front, I have decided to avoid trading for the next few sessions.
The market is currently a battlefield of news rather than numbers. I’m not looking to get rich quick; I’m looking to ensure I have capital left when the dust finally settles. Let the market find a new equilibrium before resuming Trading.
✏️ Disclaimer
This is my personal digital diary and represents my own analysis and point of view. It is not financial advice; please consult a professional advisor before making any trading decisions.
23,700 Stand: Resilience After a 600-Point Geopolitical Storm!
🗞 Nifty Summary
Driven by negative global sentiment, geopolitical turmoil, and a surge in crude prices, the Nifty faced a staggering 600-point Gap Down today. The initial minutes saw an 88-point recovery attempt, but the pressure was too great, causing a deep 262-point plunge from the morning high to mark a day low at 23,697.80 (23,700).
This level acted as a rock-solid floor. From here, Nifty began a slow, steady, and disciplined climb toward the Initial Balance High (IBH). After multiple failed attempts to break the ceiling, the bulls finally succeeded around 2:40 PM, reclaiming the day high at 24,078.
The index eventually ended the session at 24,007.60 (Adjusted close: 24,028.05), losing -422.40 points (-1.73%). While the net change remains deeply in the red, the intraday structure tells a story of extreme resilience, with bulls absorbing a massive amount of selling pressure from the morning lows.
The volatility was mirrored in the oil markets; Brent Crude hit a high of 113.73 before losing 10 dollars mid-session. This kind of wild reaction is likely to persist in our markets for the upcoming sessions.
On the Daily time frame, despite the gap, we see a strong bullish recovery body, suggesting that buyers are finding value even in this environment of fear.
🛡 5 Min Intraday Chart with Levels
📉 Daily Time Frame Chart with Intraday Levels
🕯 Daily Candle Breakdown
Open: 23,868.05
High: 24,078.15
Low: 23,697.80
Close: 24,028.05
Change: -422.40 (-1.73%)
🏗️ Structure Breakdown
Type: Strong Bullish Candle (Intraday Recovery).
Range: ≈ 380 points — Very high volatility.
Body: ≈ 160 points — Solid bullish real body after the open.
Upper Wick: ≈ 50 points — Minor resistance encountered near the day’s peak.
Lower Wick: ≈ 170 points — Aggressive buying rejection from the 23,700 base.
🛡 5 Min Intraday Chart
⚔️ Gladiator Strategy Update
ATR: 386.38
IB Range: 261.90 → Medium (Relative to current volatility)
Market Structure: Imbalanced
Trade Highlights:
No Trade Day
Trade Summary: I chose to stay away from the trade terminal and be a spectator today. The combination of a massive opening gap and extreme geopolitical uncertainty made the directional bias very low-conviction. As a conservative trader, I prefer capital protection over chasing wild moves. When stop-losses are 2-3x wider than normal due to high ATR, even a winning trade can be stressful. Technical analysis is often less effective when a single headline or tweet can override every support and resistance level.
🧱 Support & Resistance Levels
Resistance Zones: 24,080 | 24,165 | 24,300 ~ 24,333
Support Zones: 23,840 | 23,780 | 23,700 (New Floor)
🧠 Final Thoughts
“Protecting capital is the only trade worth making in a war zone.”
With weekly expiry approaching and no signs of peace on the war front, I have decided to avoid trading for the next few sessions.
The market is currently a battlefield of news rather than numbers. I’m not looking to get rich quick; I’m looking to ensure I have capital left when the dust finally settles. Let the market find a new equilibrium before resuming Trading.
✏️ Disclaimer
This is my personal digital diary and represents my own analysis and point of view. It is not financial advice; please consult a professional advisor before making any trading decisions.

Read my blogs here:
substack.com/@kzatakia
Follow me on Telegram:
t.me/swingtraderhub
Follow me on X:
x.com/kzatakia
substack.com/@kzatakia
Follow me on Telegram:
t.me/swingtraderhub
Follow me on X:
x.com/kzatakia
פרסומים קשורים
כתב ויתור
המידע והפרסומים אינם מיועדים להיות, ואינם מהווים, ייעוץ או המלצה פיננסית, השקעתית, מסחרית או מכל סוג אחר המסופקת או מאושרת על ידי TradingView. קרא עוד ב־תנאי השימוש.
Read my blogs here:
substack.com/@kzatakia
Follow me on Telegram:
t.me/swingtraderhub
Follow me on X:
x.com/kzatakia
substack.com/@kzatakia
Follow me on Telegram:
t.me/swingtraderhub
Follow me on X:
x.com/kzatakia
פרסומים קשורים
כתב ויתור
המידע והפרסומים אינם מיועדים להיות, ואינם מהווים, ייעוץ או המלצה פיננסית, השקעתית, מסחרית או מכל סוג אחר המסופקת או מאושרת על ידי TradingView. קרא עוד ב־תנאי השימוש.