
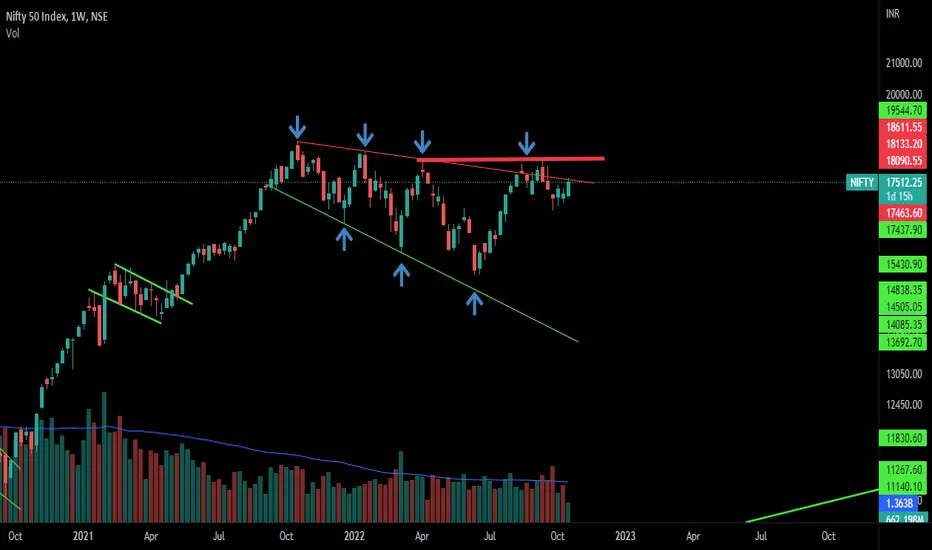
A trendline from the last year's 2021 October highs is where Nifty is facing resistance right now.
Once this is crossed then the immediate resistance will be recent highs which is at 18100.
If it couldn't sustain then Nifty might see 16300 again.
This week's closing candle can give us a clear picture of the upcoming Nifty move.
Watch out for upcoming moves.
Once this is crossed then the immediate resistance will be recent highs which is at 18100.
If it couldn't sustain then Nifty might see 16300 again.
This week's closing candle can give us a clear picture of the upcoming Nifty move.
Watch out for upcoming moves.

GK_Cheerla
כתב ויתור
המידע והפרסומים אינם מיועדים להיות, ואינם מהווים, ייעוץ או המלצה פיננסית, השקעתית, מסחרית או מכל סוג אחר המסופקת או מאושרת על ידי TradingView. קרא עוד ב־תנאי השימוש.
GK_Cheerla
כתב ויתור
המידע והפרסומים אינם מיועדים להיות, ואינם מהווים, ייעוץ או המלצה פיננסית, השקעתית, מסחרית או מכל סוג אחר המסופקת או מאושרת על ידי TradingView. קרא עוד ב־תנאי השימוש.