
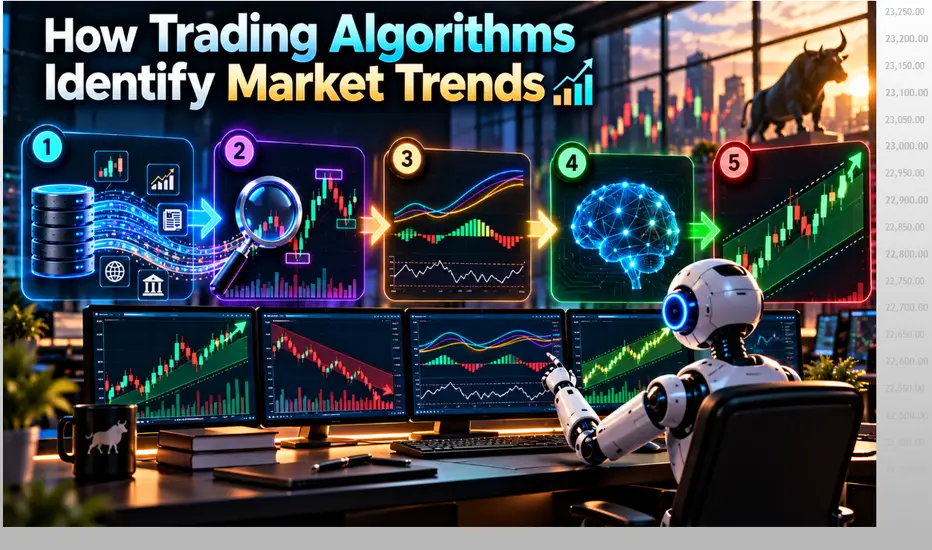
🤖 How Trading Algorithms Identify Market Trends
A trader can look at a chart and say: “This market looks bullish.”
But an algorithm needs something more precise. It must convert the trend into measurable conditions.
For example:
Higher Highs + Higher Lows
+ Price Above VWAP
+ 20 EMA Above 50 EMA
+ Trend Strength
= **Bullish Trend**
---------------------------------
📊 Price Structure Comes First
A simple bullish structure looks like:
**HH → HL → HH → HL**
A bearish structure looks like:
**LL → LH → LL → LH**
Algorithms can identify confirmed swing highs and lows and compare them automatically. This turns price action into machine-readable trend logic.
---------------------------------
📈 Moving Averages Help Filter Direction
Example:
Price > 20 EMA
20 EMA > 50 EMA
Both averages rising
= Bullish alignment
For bearish conditions:
Price < 20 EMA
20 EMA < 50 EMA
Both averages falling
= Bearish alignment
A crossover alone may not be enough, especially in a sideways market.
---------------------------------
📊 VWAP Can Help With Intraday Trend
A bullish intraday environment may show:
✅ Price above VWAP
✅ VWAP rising
✅ Pullbacks holding VWAP
A bearish environment may show the opposite.
If VWAP is flat and price keeps crossing it: The algorithm may classify the market as **sideways**.
---------------------------------
⚡ Direction Is Not the Same as Strength
A market can be bullish but weak.
That is why algorithms may also use:
• ADX
• EMA slope
• ATR expansion
• Rate of change
• Volume
These help answer:
“Is this actually trending strongly enough to trade?”
---------------------------------
🔍 Higher-Timeframe Context Matters
Example:
Now multiple timeframes agree. But if the higher timeframe is bearish, the same lower-timeframe long setup may be filtered out.
---------------------------------
📊 Algorithms Can Use a Trend Score
Example:
Price above 50 EMA = 20
EMA alignment = 20
Bullish structure = 20
VWAP alignment = 15
ADX = 15
Volume = 10
Total = 100
The system can then classify:
Strong Bullish
Mild Bullish
Neutral
Mild Bearish
Strong Bearish
The exact scoring model should always be tested.
---------------------------------
⚠️ Sideways Is Also a Valid Answer
One of the biggest mistakes is forcing every market into:
Bullish or Bearish.
Sometimes the correct algorithmic classification is:
**NO TREND**
Possible clues:
• Flat moving averages
• Low ADX
• Narrow ATR
• Repeated VWAP crosses
• No clean HH/HL or LH/LL sequence
In that environment, a trend-following strategy may simply stay inactive.
---------------------------------
📊 Simple Formula
Price Structure + Direction Filter + Trend Strength + Confirmation
= Trend Classification
Trend Classification + Setup Trigger
= Higher-Quality Trade Opportunity
But:
No Clear Trend
= WAIT
---------------------------------
📊 Finally, the important point to note is:
Algorithms do not need to predict exactly where the market will go. They only need to classify the current environment consistently.
The goal is to identify:
**Bullish → Bearish → Sideways**
using objective evidence.
A good trend engine helps the strategy trade with the market environment instead of fighting it.
---------------------------------
Educational Purpose Only. Whats Your View On this Idea ? Comment Below !!
A trader can look at a chart and say: “This market looks bullish.”
But an algorithm needs something more precise. It must convert the trend into measurable conditions.
For example:
Higher Highs + Higher Lows
+ Price Above VWAP
+ 20 EMA Above 50 EMA
+ Trend Strength
= **Bullish Trend**
---------------------------------
📊 Price Structure Comes First
A simple bullish structure looks like:
**HH → HL → HH → HL**
A bearish structure looks like:
**LL → LH → LL → LH**
Algorithms can identify confirmed swing highs and lows and compare them automatically. This turns price action into machine-readable trend logic.
---------------------------------
📈 Moving Averages Help Filter Direction
Example:
Price > 20 EMA
20 EMA > 50 EMA
Both averages rising
= Bullish alignment
For bearish conditions:
Price < 20 EMA
20 EMA < 50 EMA
Both averages falling
= Bearish alignment
A crossover alone may not be enough, especially in a sideways market.
---------------------------------
📊 VWAP Can Help With Intraday Trend
A bullish intraday environment may show:
✅ Price above VWAP
✅ VWAP rising
✅ Pullbacks holding VWAP
A bearish environment may show the opposite.
If VWAP is flat and price keeps crossing it: The algorithm may classify the market as **sideways**.
---------------------------------
⚡ Direction Is Not the Same as Strength
A market can be bullish but weak.
That is why algorithms may also use:
• ADX
• EMA slope
• ATR expansion
• Rate of change
• Volume
These help answer:
“Is this actually trending strongly enough to trade?”
---------------------------------
🔍 Higher-Timeframe Context Matters
Example:
- 1-Hour Trend = Bullish
- 15-Minute Setup = Bullish Pullback
- 5-Minute Trigger = Confirmed
Now multiple timeframes agree. But if the higher timeframe is bearish, the same lower-timeframe long setup may be filtered out.
---------------------------------
📊 Algorithms Can Use a Trend Score
Example:
Price above 50 EMA = 20
EMA alignment = 20
Bullish structure = 20
VWAP alignment = 15
ADX = 15
Volume = 10
Total = 100
The system can then classify:
Strong Bullish
Mild Bullish
Neutral
Mild Bearish
Strong Bearish
The exact scoring model should always be tested.
---------------------------------
⚠️ Sideways Is Also a Valid Answer
One of the biggest mistakes is forcing every market into:
Bullish or Bearish.
Sometimes the correct algorithmic classification is:
**NO TREND**
Possible clues:
• Flat moving averages
• Low ADX
• Narrow ATR
• Repeated VWAP crosses
• No clean HH/HL or LH/LL sequence
In that environment, a trend-following strategy may simply stay inactive.
---------------------------------
📊 Simple Formula
Price Structure + Direction Filter + Trend Strength + Confirmation
= Trend Classification
Trend Classification + Setup Trigger
= Higher-Quality Trade Opportunity
But:
No Clear Trend
= WAIT
---------------------------------
📊 Finally, the important point to note is:
Algorithms do not need to predict exactly where the market will go. They only need to classify the current environment consistently.
The goal is to identify:
**Bullish → Bearish → Sideways**
using objective evidence.
A good trend engine helps the strategy trade with the market environment instead of fighting it.
---------------------------------
Educational Purpose Only. Whats Your View On this Idea ? Comment Below !!

⭐For Live Trading Courses And Trading Community 📈
Contact ⬇️
📱wa.me/919322295961
📱t.me/+UgF9lES_XxA0MTk9
⭐Advanced courses
⭐Fully Automated Algo Trading
⭐Daily F&O Trade tips
📱 t.me/+UgF9lES_XxA0MTk9
Contact ⬇️
📱wa.me/919322295961
📱t.me/+UgF9lES_XxA0MTk9
⭐Advanced courses
⭐Fully Automated Algo Trading
⭐Daily F&O Trade tips
📱 t.me/+UgF9lES_XxA0MTk9
פרסומים קשורים
כתב ויתור
המידע והפרסומים אינם מיועדים להיות, ואינם מהווים, ייעוץ או המלצה פיננסית, השקעתית, מסחרית או מכל סוג אחר המסופקת או מאושרת על ידי TradingView. קרא עוד ב־תנאי השימוש.
⭐For Live Trading Courses And Trading Community 📈
Contact ⬇️
📱wa.me/919322295961
📱t.me/+UgF9lES_XxA0MTk9
⭐Advanced courses
⭐Fully Automated Algo Trading
⭐Daily F&O Trade tips
📱 t.me/+UgF9lES_XxA0MTk9
Contact ⬇️
📱wa.me/919322295961
📱t.me/+UgF9lES_XxA0MTk9
⭐Advanced courses
⭐Fully Automated Algo Trading
⭐Daily F&O Trade tips
📱 t.me/+UgF9lES_XxA0MTk9
פרסומים קשורים
כתב ויתור
המידע והפרסומים אינם מיועדים להיות, ואינם מהווים, ייעוץ או המלצה פיננסית, השקעתית, מסחרית או מכל סוג אחר המסופקת או מאושרת על ידי TradingView. קרא עוד ב־תנאי השימוש.