
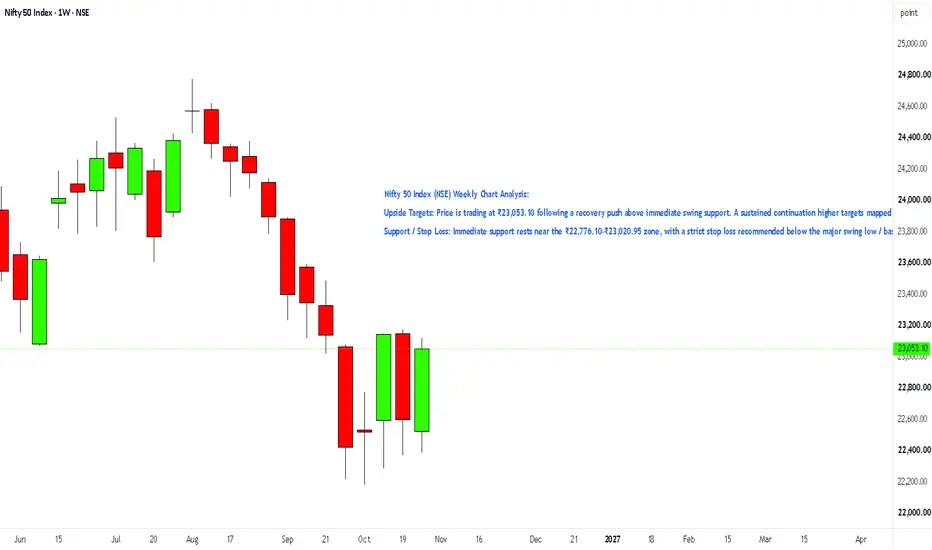
Nifty 50 Index (NSE) Weekly Chart Analysis:
Upside Targets: Price is trading at ₹23,053.10 following a recovery push above immediate swing support. A sustained continuation higher targets mapped levels at ₹23,569.70 (T1), ₹23,848.85 (T2), and ₹24,300.45 (T3).
Support / Stop Loss: Immediate support rests near the ₹22,776.10–₹23,020.95 zone, with a strict stop loss recommended below the major swing low / base near ₹22,179.90 to manage downside risk.
Upside Targets: Price is trading at ₹23,053.10 following a recovery push above immediate swing support. A sustained continuation higher targets mapped levels at ₹23,569.70 (T1), ₹23,848.85 (T2), and ₹24,300.45 (T3).
Support / Stop Loss: Immediate support rests near the ₹22,776.10–₹23,020.95 zone, with a strict stop loss recommended below the major swing low / base near ₹22,179.90 to manage downside risk.

Automated Tools/Indicators/Screeners available at kkonline.org/nimblrta
כתב ויתור
המידע והפרסומים אינם מיועדים להיות, ואינם מהווים, ייעוץ או המלצה פיננסית, השקעתית, מסחרית או מכל סוג אחר המסופקת או מאושרת על ידי TradingView. קרא עוד ב־תנאי השימוש.
Automated Tools/Indicators/Screeners available at kkonline.org/nimblrta
כתב ויתור
המידע והפרסומים אינם מיועדים להיות, ואינם מהווים, ייעוץ או המלצה פיננסית, השקעתית, מסחרית או מכל סוג אחר המסופקת או מאושרת על ידי TradingView. קרא עוד ב־תנאי השימוש.