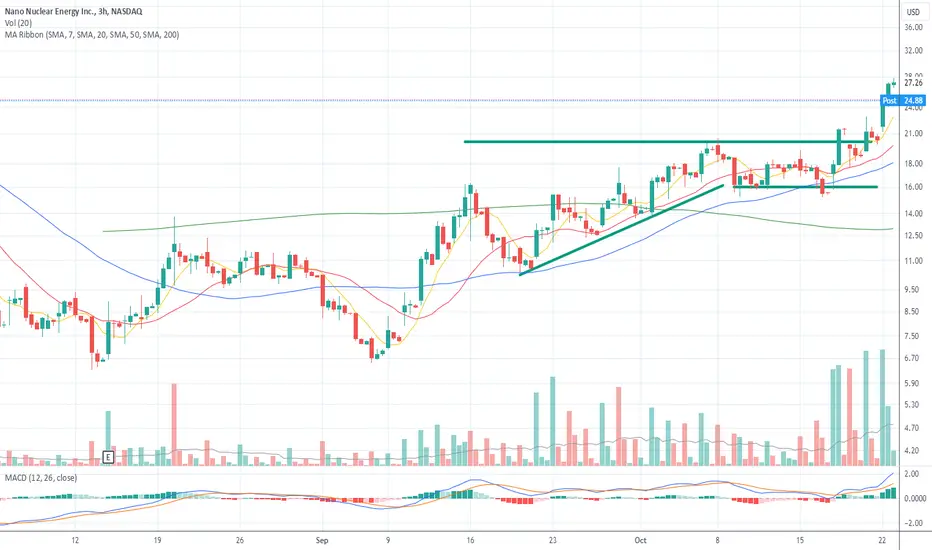
 NNE Graph illustration in practice:
It's not very clean when there is high volatility, but the principle remains the same.
First bullish leg of more than 30% (here +100%), higher lows, volatility contraction, price riding the moving averages (-> the Fork Toto), formation of a tight base -> pattern like RDM or VCP 🔥🔥
The difference between a pattern that works and one that doesn't lies in what fuels it.
We observe this with a change in volume behavior: large buyer volumes and low seller volumes.
In this case, the fuel is investors' interest in new AI technology.

כתב ויתור
המידע והפרסומים אינם מיועדים להיות, ואינם מהווים, ייעוץ או המלצה פיננסית, השקעתית, מסחרית או מכל סוג אחר המסופקת או מאושרת על ידי TradingView. קרא עוד ב־תנאי השימוש.
כתב ויתור
המידע והפרסומים אינם מיועדים להיות, ואינם מהווים, ייעוץ או המלצה פיננסית, השקעתית, מסחרית או מכל סוג אחר המסופקת או מאושרת על ידי TradingView. קרא עוד ב־תנאי השימוש.