
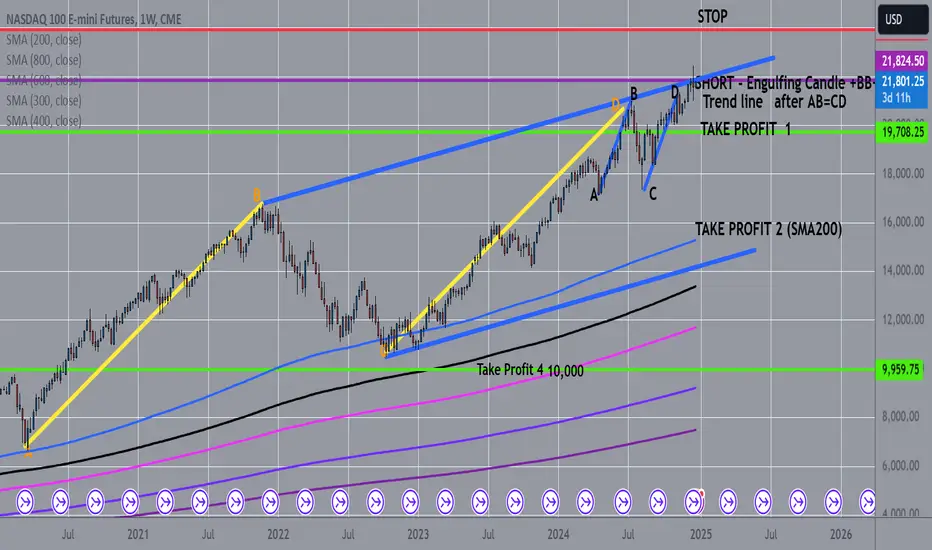
Nasdaq100 Short Weekly Chart, Price after big and small AB=CD + BB+ Trendline+ Engulfing candle at the top, price should go now to Take profit 1 area, and from there if will not be a real support it will go to test the SMA200, for take profit 2 odds are much more small but possible

כתב ויתור
המידע והפרסומים אינם מיועדים להיות, ואינם מהווים, ייעוץ או המלצה פיננסית, השקעתית, מסחרית או מכל סוג אחר המסופקת או מאושרת על ידי TradingView. קרא עוד ב־תנאי השימוש.
כתב ויתור
המידע והפרסומים אינם מיועדים להיות, ואינם מהווים, ייעוץ או המלצה פיננסית, השקעתית, מסחרית או מכל סוג אחר המסופקת או מאושרת על ידי TradingView. קרא עוד ב־תנאי השימוש.