
📌 TradingView Strategy Properties Explained — Part 1
When you apply a strategy in TradingView, the Strategy Properties tab defines important assumptions about how that strategy is backtested.
Part 1 covers four settings that shape the simulated portfolio:
• Initial Capital
• Base Currency
• Order Size ( Cash amount, Quantity, or % Equity)
• Pyramiding
Two strategies can have identical entry and exit logic and still produce very different backtest results when these settings are different.
Note: Quantity refers to number of shares or contracts.
________________________________________
1. 💰 Initial Capital
Initial Capital is the starting amount from which the backtest begins.
It determines the buying power available to the strategy and, depending on the position-sizing method, can also affect the size of subsequent positions and the strategy’s ability to withstand losses before trading can no longer continue.
💡 Practical point: When comparing two strategies, use the same initial capital whenever you want the comparison to focus on differences in strategy behavior rather than differences in starting capital.
________________________________________
2. 💱 Base Currency
Base Currency determines the currency you want to use when interpreting the strategy’s financial results.
It affects how the strategy expresses:
• Initial Capital
• Strategy Equity
• Profit and Loss
• Drawdown
• Cash Amount order sizes
For example, a strategy can trade a USD-denominated stock while its results are evaluated in another currency. In that situation, the selected Base Currency determines how the monetary results are presented after currency conversion.
If you leave the setting at “Default,” TradingView uses the symbol’s own currency rather than converting the results to another currency.
💡 Practical point:
When comparing backtests or evaluating results in a specific currency, check the Base Currency setting first. A difference in currency settings can affect the monetary figures you see even when the underlying trades are identical.
________________________________________
3. 📦 Order Size — How Much Are You Actually Trading?
Order Size determines how the strategy translates a trading signal into a position.
There are three ways to size a position:
• Contracts / fixed quantity — the same quantity every trade, win or lose
• Cash amount — roughly the same cash value allocated per trade
• % of equity — position size scales with the account, growing after wins and shrinking after losses
Contracts / Fixed Quantity
The strategy uses the specified quantity on each order.
For example, for each trade:
100 shares → 100 shares → 100 shares
The quantity of shares does not automatically increase because strategy equity has grown or decrease because strategy equity has fallen.
When it can be useful:
• For testing signal quality without equity compounding, provided the instrument's price doesn't change dramatically over the test period.
• When comparing strategies or parameter sets against each other, since position size never changes — differences in the equity curve come from the entries/exits themselves.
• Realistic for traders who genuinely size the same way in live trading — e.g., always 100 shares, always 1 futures contract, regardless of capital value.
However, an important distinction is often overlooked:
Fixed quantity keeps the quantity constant — not the cash value of the position.
If the price of the instrument rises substantially, the same number of shares can represent a much larger cash position. If the price falls, the cash value falls.
💡 Practical point: Fixed quantity removes equity-based position-size compounding, but it does not remove the effect of the instrument’s price movement.
________________________________________
Cash Amount
The strategy attempts to allocate a specified cash amount to each order.
For example, a $100,000 allocation would generally result in approximately:
$100,000 → $100,000 → $100,000
with the number of shares changing as the instrument’s price changes.
When it can be useful:
• Useful for testing the same strategy on instruments at different price levels, where a fixed contract count or number of shares would mean wildly different monetary exposure per trade.
• Keeps exposure roughly comparable trade to trade in monetary terms, even as price itself moves.
• Doesn’t compound with account equity — a losing streak doesn’t shrink the next trade’s size, a winning streak doesn’t grow it.
Unlike % of Equity, the specified cash amount does not automatically increase when strategy equity grows or decrease when strategy equity falls.
💡 Practical point: Fixed cash keeps the intended cash allocation relatively stable, but it does not automatically adapt to changes in strategy equity.
________________________________________
% of Equity
The strategy calculates the position size as a specified percentage of current strategy equity when the trade opens.
For example, with $1,000,000 of strategy equity:
50% of Equity = $500,000
If strategy equity subsequently grows to $1,200,000:
50% of Equity = $600,000
If strategy equity falls to $800,000:
50% of Equity = $400,000
The position therefore changes with strategy equity.
When it can be useful:
• Useful for approximating a live account in which the trader resizes with equity, so position size grows after gains and shrinks after losses.
• Needed if you want the test to show how the strategy compounds equity. Position size scales with current strategy equity, so gains are reinvested and losses reduce future size. A fixed quantity ties size to a constant number of shares, and fixed cash ties it to a constant monetary amount, so neither reinvests the strategy's profits. Any growth in capital deployed under a fixed quantity comes from the asset's price movement, not from the strategy's performance.
💡 Practical point: This setting can be appropriate for long-horizon evaluation because it models how a strategy compounds. Since gains and losses compound, the outcome is affected by the variability of trade returns: if equity falls 20% and then rises 20%, it ends 4% lower, not back where it started.
________________________________________
Why Not Use 100% of Capital?
A natural question is:
If I have $1 million of initial capital, why not put the entire $1 million into every trade?
Using 100% of Equity maximizes the amount of strategy equity allocated to each position (under the same margin and leverage assumptions), but it also maximizes the effect of each trade’s gain or loss on strategy equity.
A trader may deliberately allocate 10%, 25%, 50%, or another percentage in order to:
• Keep capital available for additional entries, such as pyramiding or monetary cost averaging
• Limit how much a single loss, or a losing streak, can take from strategy equity
• Maintain a cash reserve
The important point is that % of Equity is dynamic: the position automatically grows when the account grows and shrinks when the account falls.
With a fixed cash amount, the specified amount does not automatically shrink when strategy equity falls. If the strategy no longer has enough available capital to support that allocation, maintaining the specified position may require additional capital, leverage, or a reduction in the intended allocation.
When Position Size Prevents Trading Order Execution
When the selected position size requires most or all of the available strategy equity, some trading orders generated by the signals may not be executed because the cash amount required for the order exceeds the strategy equity available at the time of execution.
This can occur when 100% of strategy equity is allocated to a position, leaving little or no cash buffer, or when a large fixed number of shares or contracts is selected and the resulting position requires more cash than is available. The strategy may still have more equity than its initial capital, but that does not necessarily mean it has enough available strategy equity to execute the next order at the selected size.
Transaction costs can further contribute to this effect because they increase the total cash required to execute a trade.
In our testing, using around 95–97% of equity rather than 100% often allowed the maximum number of trade signals to be executed. The exact threshold depends on the strategy and its other settings. This can lead to a different number of trades and substantially different backtest results, even when the underlying trading signals are identical.
________________________________________
📐 Cumulative Return is Measured Against Capital, Not Position Size
TradingView's cumulative return percentage is measured relative to the strategy's initial capital, not relative to the size of the position that produced the profit.
Suppose the strategy has $1,000,000 of capital, and a trade's price rises 10% from entry to exit:
• $500,000 position: the profit is $50,000, which is 5% of capital.
• $100,000 position: the profit is $10,000, which is 1% of capital.
The signal was the same, the trade was the same, and the price move was the same 10%. The reported percentage differs only because a different amount of capital was put to work.
This matters when comparing backtests. A strategy that shows a smaller percentage return may not have weaker signals. It may simply have deployed less capital per trade. The same applies to drawdown: larger positions produce larger percentage swings in equity.
💡 Practical point: To judge the signals themselves, compare each trade's return on capital deployed as shown in the “Return” column in the “List of Trades” report. To judge the sizing method, compare exposure, total profit, and drawdown.
________________________________________
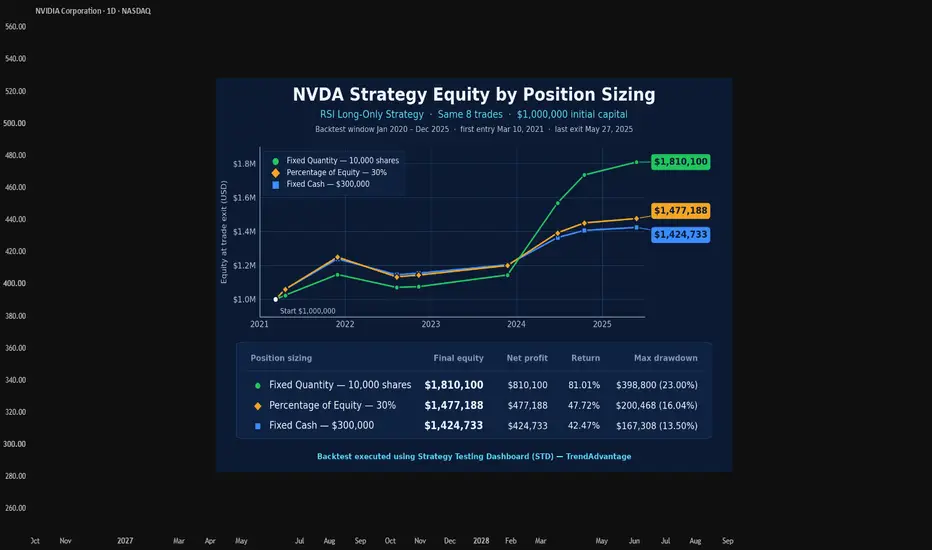
📊 Position Sizing Comparison: A Real NVIDIA Example (Chart Displayed Above)
The following is a real backtest example using NVIDIA (NVDA) covering the period from January 2020 through December 2025. The trades were generated using an RSI crossover strategy with long positions only.
Three different position-sizing methods were tested: Fixed Quantity (10,000 shares), Fixed Cash ($300,000), and Percentage of Equity (30%). An initial capital of $1,000,000 was selected for all methods. The actual capital deployed on the first trade was approx. $300,000 for both Fixed Cash and Percentage of Equity, and approx. $128,500 for Fixed Quantity (10,000 shares multiplied by the first entry price of $12.85), which is less than 50% of the other two methods. All three methods executed the same eight trades on the same dates, allowing the effect of position sizing to be compared without differences in the underlying trading signals.
Since the trades are identical, differences in the equity curves, final strategy equity, profitability, and drawdown result from how each position-sizing method determines the exposure assigned to those trades. The example illustrates how different position-sizing methods can produce substantially different results even when applied to the same trading signals.
Cumulative Return vs. Drawdown
Cumulative return and maximum drawdown percentage use different reference points. Cumulative return measures the change in strategy equity relative to the initial capital. Maximum drawdown percentage measures the largest decline from an equity peak to a subsequent trough, expressed as a percentage of that peak, so its reference point is the equity peak rather than the initial capital.
The cumulative return and maximum drawdown figures for all three methods are as reported directly by TradingView's Strategy Tester. The strategy equity curves show values at trade close only; maximum drawdown occurred while a position was still open and is not visible as a curve minimum.
Outcome of each Position Sizing Method
With Fixed Quantity (10,000 shares), the strategy finishes with $1,810,100 in strategy equity, representing a $810,100 net profit or 81.01% cumulative return. The maximum drawdown is approximately $398,800 (23.00%).
With Fixed Cash ($300,000), the strategy finishes with $1,424,733 in strategy equity, producing a $424,733 net profit or 42.47% cumulative return. Maximum drawdown is approximately $167,308 (13.50%).
With Percentage of Equity (30%), the strategy finishes with $1,477,188 in strategy equity, producing a $477,188 net profit or 47.72% cumulative return. Maximum drawdown is approximately $200,468 (16.04%).
Fixed Quantity finished highest despite deploying the least capital on the first trade because NVDA's price rose more than tenfold over the period. The same 10,000 shares represented a much larger cash position in later trades, which also explains its larger drawdown.
Method Final Equity Return Max DD
Fixed Qty 10k shares $1,810,100 81.01% 23.00%
Fixed Cash $300k $1,424,733 42.47% 13.50%
% of Equity 30% $1,477,188 47.72% 16.04%
This example demonstrates how position sizing can materially change final strategy equity, profitability, and drawdown even when the underlying trading signals and number of executed trades remain identical.
Therefore, when evaluating a strategy, it is important to distinguish between the performance of the trading signals and the performance produced by the selected position-sizing method. When the same trades are executed, differences in the results reflect how each sizing method translates those signals into market exposure.
________________________________________
⚠️ The Key Point About Order Size
The three methods are not answering exactly the same question.
• Fixed Quantity: What happens if I keep the quantity constant?
• Fixed Cash: What happens if I keep the intended cash allocation relatively constant?
• % of Equity: What happens if position size changes with strategy equity?
All three can be valid ways of testing a strategy. The appropriate choice depends on what you are trying to model.
Therefore, when comparing strategies or parameter sets, keep the position-sizing assumptions consistent. Otherwise, differences in the results may reflect both the trading strategy and the sizing method.
________________________________________
4. 🧱 Pyramiding
Pyramiding controls how many same-direction entries a strategy can add to an existing position through new strategy entry signals.
For example, with pyramiding set to allow only one entry, a strategy cannot use additional strategy entry signals to add to a long or short position it already holds.
Increasing the pyramiding value allows additional entries and can therefore increase the strategy’s exposure.
One important detail: the pyramiding limit applies specifically to orders generated through strategy.entry(). Orders generated through strategy.order() are not subject to the pyramiding property in the same way.
💡 Practical point: More pyramiding does not automatically mean better performance. Increasing the number of entries can increase both potential gains and potential losses by increasing exposure.
________________________________________
📋 Part 1 at a Glance
Before Looking at the Backtest Results:
☐ Is Initial Capital appropriate for the strategy I am trying to model?
☐ Is Base Currency consistent with how I want the results reported?
☐ Does Order Size (Cash, Quantity, or % of Equity) reflect how I would actually size positions?
☐ Do I understand whether my chosen sizing method allows position size to compound as strategy equity changes?
☐ Is Pyramiding set to allow additional entries into an existing position?
Conclusion
📌 These four settings define the basic economic structure of the simulated strategy:
where it starts, what currency it uses, how positions are sized, and whether positions can be built up through additional entries.
Before asking:
"How profitable is this strategy?"
also ask:
"Under what initial capital, sizing, and exposure assumptions was that result produced?"
The trading signals are only part of the backtest. Strategy Properties determine how those signals are translated into simulated strategy-equity results.
________________________________________
Part 2 covers Commission, Verify Price For Limit Orders, Slippage, Margin, Recalculate, and Fill Orders.
Source: TradingView Help Center — Strategy properties
TradingView Strategy Properties — Educational Reference TrendAdvantage
When you apply a strategy in TradingView, the Strategy Properties tab defines important assumptions about how that strategy is backtested.
Part 1 covers four settings that shape the simulated portfolio:
• Initial Capital
• Base Currency
• Order Size ( Cash amount, Quantity, or % Equity)
• Pyramiding
Two strategies can have identical entry and exit logic and still produce very different backtest results when these settings are different.
Note: Quantity refers to number of shares or contracts.
________________________________________
1. 💰 Initial Capital
Initial Capital is the starting amount from which the backtest begins.
It determines the buying power available to the strategy and, depending on the position-sizing method, can also affect the size of subsequent positions and the strategy’s ability to withstand losses before trading can no longer continue.
💡 Practical point: When comparing two strategies, use the same initial capital whenever you want the comparison to focus on differences in strategy behavior rather than differences in starting capital.
________________________________________
2. 💱 Base Currency
Base Currency determines the currency you want to use when interpreting the strategy’s financial results.
It affects how the strategy expresses:
• Initial Capital
• Strategy Equity
• Profit and Loss
• Drawdown
• Cash Amount order sizes
For example, a strategy can trade a USD-denominated stock while its results are evaluated in another currency. In that situation, the selected Base Currency determines how the monetary results are presented after currency conversion.
If you leave the setting at “Default,” TradingView uses the symbol’s own currency rather than converting the results to another currency.
💡 Practical point:
When comparing backtests or evaluating results in a specific currency, check the Base Currency setting first. A difference in currency settings can affect the monetary figures you see even when the underlying trades are identical.
________________________________________
3. 📦 Order Size — How Much Are You Actually Trading?
Order Size determines how the strategy translates a trading signal into a position.
There are three ways to size a position:
• Contracts / fixed quantity — the same quantity every trade, win or lose
• Cash amount — roughly the same cash value allocated per trade
• % of equity — position size scales with the account, growing after wins and shrinking after losses
Contracts / Fixed Quantity
The strategy uses the specified quantity on each order.
For example, for each trade:
100 shares → 100 shares → 100 shares
The quantity of shares does not automatically increase because strategy equity has grown or decrease because strategy equity has fallen.
When it can be useful:
• For testing signal quality without equity compounding, provided the instrument's price doesn't change dramatically over the test period.
• When comparing strategies or parameter sets against each other, since position size never changes — differences in the equity curve come from the entries/exits themselves.
• Realistic for traders who genuinely size the same way in live trading — e.g., always 100 shares, always 1 futures contract, regardless of capital value.
However, an important distinction is often overlooked:
Fixed quantity keeps the quantity constant — not the cash value of the position.
If the price of the instrument rises substantially, the same number of shares can represent a much larger cash position. If the price falls, the cash value falls.
💡 Practical point: Fixed quantity removes equity-based position-size compounding, but it does not remove the effect of the instrument’s price movement.
________________________________________
Cash Amount
The strategy attempts to allocate a specified cash amount to each order.
For example, a $100,000 allocation would generally result in approximately:
$100,000 → $100,000 → $100,000
with the number of shares changing as the instrument’s price changes.
When it can be useful:
• Useful for testing the same strategy on instruments at different price levels, where a fixed contract count or number of shares would mean wildly different monetary exposure per trade.
• Keeps exposure roughly comparable trade to trade in monetary terms, even as price itself moves.
• Doesn’t compound with account equity — a losing streak doesn’t shrink the next trade’s size, a winning streak doesn’t grow it.
Unlike % of Equity, the specified cash amount does not automatically increase when strategy equity grows or decrease when strategy equity falls.
💡 Practical point: Fixed cash keeps the intended cash allocation relatively stable, but it does not automatically adapt to changes in strategy equity.
________________________________________
% of Equity
The strategy calculates the position size as a specified percentage of current strategy equity when the trade opens.
For example, with $1,000,000 of strategy equity:
50% of Equity = $500,000
If strategy equity subsequently grows to $1,200,000:
50% of Equity = $600,000
If strategy equity falls to $800,000:
50% of Equity = $400,000
The position therefore changes with strategy equity.
When it can be useful:
• Useful for approximating a live account in which the trader resizes with equity, so position size grows after gains and shrinks after losses.
• Needed if you want the test to show how the strategy compounds equity. Position size scales with current strategy equity, so gains are reinvested and losses reduce future size. A fixed quantity ties size to a constant number of shares, and fixed cash ties it to a constant monetary amount, so neither reinvests the strategy's profits. Any growth in capital deployed under a fixed quantity comes from the asset's price movement, not from the strategy's performance.
💡 Practical point: This setting can be appropriate for long-horizon evaluation because it models how a strategy compounds. Since gains and losses compound, the outcome is affected by the variability of trade returns: if equity falls 20% and then rises 20%, it ends 4% lower, not back where it started.
________________________________________
Why Not Use 100% of Capital?
A natural question is:
If I have $1 million of initial capital, why not put the entire $1 million into every trade?
Using 100% of Equity maximizes the amount of strategy equity allocated to each position (under the same margin and leverage assumptions), but it also maximizes the effect of each trade’s gain or loss on strategy equity.
A trader may deliberately allocate 10%, 25%, 50%, or another percentage in order to:
• Keep capital available for additional entries, such as pyramiding or monetary cost averaging
• Limit how much a single loss, or a losing streak, can take from strategy equity
• Maintain a cash reserve
The important point is that % of Equity is dynamic: the position automatically grows when the account grows and shrinks when the account falls.
With a fixed cash amount, the specified amount does not automatically shrink when strategy equity falls. If the strategy no longer has enough available capital to support that allocation, maintaining the specified position may require additional capital, leverage, or a reduction in the intended allocation.
When Position Size Prevents Trading Order Execution
When the selected position size requires most or all of the available strategy equity, some trading orders generated by the signals may not be executed because the cash amount required for the order exceeds the strategy equity available at the time of execution.
This can occur when 100% of strategy equity is allocated to a position, leaving little or no cash buffer, or when a large fixed number of shares or contracts is selected and the resulting position requires more cash than is available. The strategy may still have more equity than its initial capital, but that does not necessarily mean it has enough available strategy equity to execute the next order at the selected size.
Transaction costs can further contribute to this effect because they increase the total cash required to execute a trade.
In our testing, using around 95–97% of equity rather than 100% often allowed the maximum number of trade signals to be executed. The exact threshold depends on the strategy and its other settings. This can lead to a different number of trades and substantially different backtest results, even when the underlying trading signals are identical.
________________________________________
📐 Cumulative Return is Measured Against Capital, Not Position Size
TradingView's cumulative return percentage is measured relative to the strategy's initial capital, not relative to the size of the position that produced the profit.
Suppose the strategy has $1,000,000 of capital, and a trade's price rises 10% from entry to exit:
• $500,000 position: the profit is $50,000, which is 5% of capital.
• $100,000 position: the profit is $10,000, which is 1% of capital.
The signal was the same, the trade was the same, and the price move was the same 10%. The reported percentage differs only because a different amount of capital was put to work.
This matters when comparing backtests. A strategy that shows a smaller percentage return may not have weaker signals. It may simply have deployed less capital per trade. The same applies to drawdown: larger positions produce larger percentage swings in equity.
💡 Practical point: To judge the signals themselves, compare each trade's return on capital deployed as shown in the “Return” column in the “List of Trades” report. To judge the sizing method, compare exposure, total profit, and drawdown.
________________________________________
📊 Position Sizing Comparison: A Real NVIDIA Example (Chart Displayed Above)
The following is a real backtest example using NVIDIA (NVDA) covering the period from January 2020 through December 2025. The trades were generated using an RSI crossover strategy with long positions only.
Three different position-sizing methods were tested: Fixed Quantity (10,000 shares), Fixed Cash ($300,000), and Percentage of Equity (30%). An initial capital of $1,000,000 was selected for all methods. The actual capital deployed on the first trade was approx. $300,000 for both Fixed Cash and Percentage of Equity, and approx. $128,500 for Fixed Quantity (10,000 shares multiplied by the first entry price of $12.85), which is less than 50% of the other two methods. All three methods executed the same eight trades on the same dates, allowing the effect of position sizing to be compared without differences in the underlying trading signals.
Since the trades are identical, differences in the equity curves, final strategy equity, profitability, and drawdown result from how each position-sizing method determines the exposure assigned to those trades. The example illustrates how different position-sizing methods can produce substantially different results even when applied to the same trading signals.
Cumulative Return vs. Drawdown
Cumulative return and maximum drawdown percentage use different reference points. Cumulative return measures the change in strategy equity relative to the initial capital. Maximum drawdown percentage measures the largest decline from an equity peak to a subsequent trough, expressed as a percentage of that peak, so its reference point is the equity peak rather than the initial capital.
The cumulative return and maximum drawdown figures for all three methods are as reported directly by TradingView's Strategy Tester. The strategy equity curves show values at trade close only; maximum drawdown occurred while a position was still open and is not visible as a curve minimum.
Outcome of each Position Sizing Method
With Fixed Quantity (10,000 shares), the strategy finishes with $1,810,100 in strategy equity, representing a $810,100 net profit or 81.01% cumulative return. The maximum drawdown is approximately $398,800 (23.00%).
With Fixed Cash ($300,000), the strategy finishes with $1,424,733 in strategy equity, producing a $424,733 net profit or 42.47% cumulative return. Maximum drawdown is approximately $167,308 (13.50%).
With Percentage of Equity (30%), the strategy finishes with $1,477,188 in strategy equity, producing a $477,188 net profit or 47.72% cumulative return. Maximum drawdown is approximately $200,468 (16.04%).
Fixed Quantity finished highest despite deploying the least capital on the first trade because NVDA's price rose more than tenfold over the period. The same 10,000 shares represented a much larger cash position in later trades, which also explains its larger drawdown.
Method Final Equity Return Max DD
Fixed Qty 10k shares $1,810,100 81.01% 23.00%
Fixed Cash $300k $1,424,733 42.47% 13.50%
% of Equity 30% $1,477,188 47.72% 16.04%
This example demonstrates how position sizing can materially change final strategy equity, profitability, and drawdown even when the underlying trading signals and number of executed trades remain identical.
Therefore, when evaluating a strategy, it is important to distinguish between the performance of the trading signals and the performance produced by the selected position-sizing method. When the same trades are executed, differences in the results reflect how each sizing method translates those signals into market exposure.
________________________________________
⚠️ The Key Point About Order Size
The three methods are not answering exactly the same question.
• Fixed Quantity: What happens if I keep the quantity constant?
• Fixed Cash: What happens if I keep the intended cash allocation relatively constant?
• % of Equity: What happens if position size changes with strategy equity?
All three can be valid ways of testing a strategy. The appropriate choice depends on what you are trying to model.
Therefore, when comparing strategies or parameter sets, keep the position-sizing assumptions consistent. Otherwise, differences in the results may reflect both the trading strategy and the sizing method.
________________________________________
4. 🧱 Pyramiding
Pyramiding controls how many same-direction entries a strategy can add to an existing position through new strategy entry signals.
For example, with pyramiding set to allow only one entry, a strategy cannot use additional strategy entry signals to add to a long or short position it already holds.
Increasing the pyramiding value allows additional entries and can therefore increase the strategy’s exposure.
One important detail: the pyramiding limit applies specifically to orders generated through strategy.entry(). Orders generated through strategy.order() are not subject to the pyramiding property in the same way.
💡 Practical point: More pyramiding does not automatically mean better performance. Increasing the number of entries can increase both potential gains and potential losses by increasing exposure.
________________________________________
📋 Part 1 at a Glance
Before Looking at the Backtest Results:
☐ Is Initial Capital appropriate for the strategy I am trying to model?
☐ Is Base Currency consistent with how I want the results reported?
☐ Does Order Size (Cash, Quantity, or % of Equity) reflect how I would actually size positions?
☐ Do I understand whether my chosen sizing method allows position size to compound as strategy equity changes?
☐ Is Pyramiding set to allow additional entries into an existing position?
Conclusion
📌 These four settings define the basic economic structure of the simulated strategy:
where it starts, what currency it uses, how positions are sized, and whether positions can be built up through additional entries.
Before asking:
"How profitable is this strategy?"
also ask:
"Under what initial capital, sizing, and exposure assumptions was that result produced?"
The trading signals are only part of the backtest. Strategy Properties determine how those signals are translated into simulated strategy-equity results.
________________________________________
Part 2 covers Commission, Verify Price For Limit Orders, Slippage, Margin, Recalculate, and Fill Orders.
Source: TradingView Help Center — Strategy properties
TradingView Strategy Properties — Educational Reference TrendAdvantage

כתב ויתור
המידע והפרסומים אינם מיועדים להיות, ואינם מהווים, ייעוץ או המלצה פיננסית, השקעתית, מסחרית או מכל סוג אחר המסופקת או מאושרת על ידי TradingView. קרא עוד ב־תנאי השימוש.
כתב ויתור
המידע והפרסומים אינם מיועדים להיות, ואינם מהווים, ייעוץ או המלצה פיננסית, השקעתית, מסחרית או מכל סוג אחר המסופקת או מאושרת על ידי TradingView. קרא עוד ב־תנאי השימוש.