
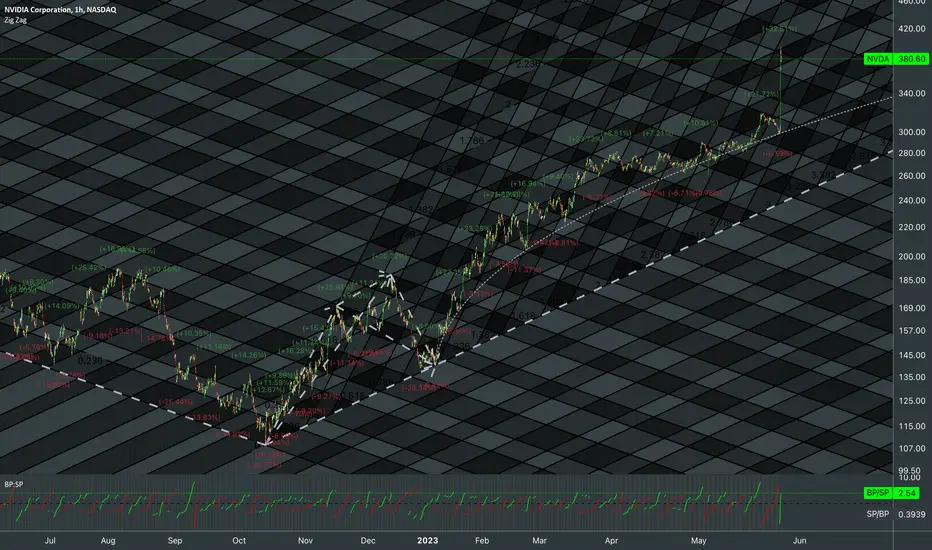
Relationship between ATH, Local bottom and first pullback in fibonacci ratio lines. Testing Buying Pressure / Selling Pressure volatility based indicator of measuring relationship between metrics of green and red candles separately. That's why there is 1 dashed line to indicate when they balance. Red line is SP / BP to see ongoing change in sellers' aspect.

Left part of the chart:

Left part of the chart:

🜲
כתב ויתור
המידע והפרסומים אינם מיועדים להיות, ואינם מהווים, ייעוץ או המלצה פיננסית, השקעתית, מסחרית או מכל סוג אחר המסופקת או מאושרת על ידי TradingView. קרא עוד ב־תנאי השימוש.
כתב ויתור
המידע והפרסומים אינם מיועדים להיות, ואינם מהווים, ייעוץ או המלצה פיננסית, השקעתית, מסחרית או מכל סוג אחר המסופקת או מאושרת על ידי TradingView. קרא עוד ב־תנאי השימוש.