
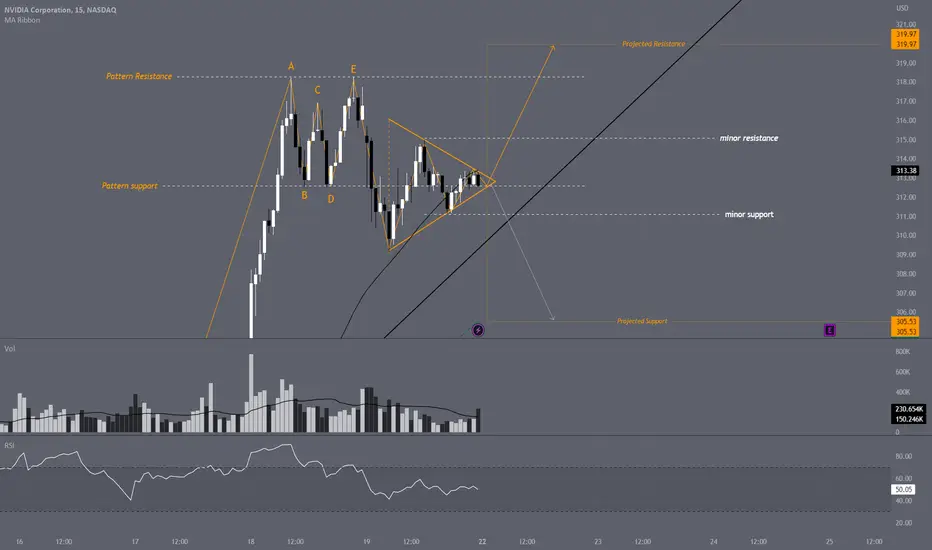
Bullish if we break out of the "Pattern Resistance" $318.28 range. (Double top)
Pullback if we break and hold under minor support, projected support found at $305.50 range should we breakout of the Symmetrical Triangle pattern.
Earnings may disrupt market structure, pre-market analysis will be crucial.
Pullback if we break and hold under minor support, projected support found at $305.50 range should we breakout of the Symmetrical Triangle pattern.
Earnings may disrupt market structure, pre-market analysis will be crucial.

כתב ויתור
המידע והפרסומים אינם מיועדים להיות, ואינם מהווים, ייעוץ או המלצה פיננסית, השקעתית, מסחרית או מכל סוג אחר המסופקת או מאושרת על ידי TradingView. קרא עוד ב־תנאי השימוש.
כתב ויתור
המידע והפרסומים אינם מיועדים להיות, ואינם מהווים, ייעוץ או המלצה פיננסית, השקעתית, מסחרית או מכל סוג אחר המסופקת או מאושרת על ידי TradingView. קרא עוד ב־תנאי השימוש.