
אינדיקטורים בלעדיים נוספים מאת BigBeluga
הירשם ל-BigBeluga Premium תמורת $66.47 לחודש כדי לקבל גישה לאינדיקטורים בלעדיים של היוצר הזה. התשלום מתבצע ישירות ב-TradingView, ואפשר להתחיל להשתמש בהם בגרפים שלך מיד.
חקור BigBeluga PremiumThis chart has two trades in it, in sequence, and they point in opposite directions. The order matters more than the direction.
━━━━━━━━━━━━━━━━━━━━
THE STRUCTURE
━━━━━━━━━━━━━━━━━━━━
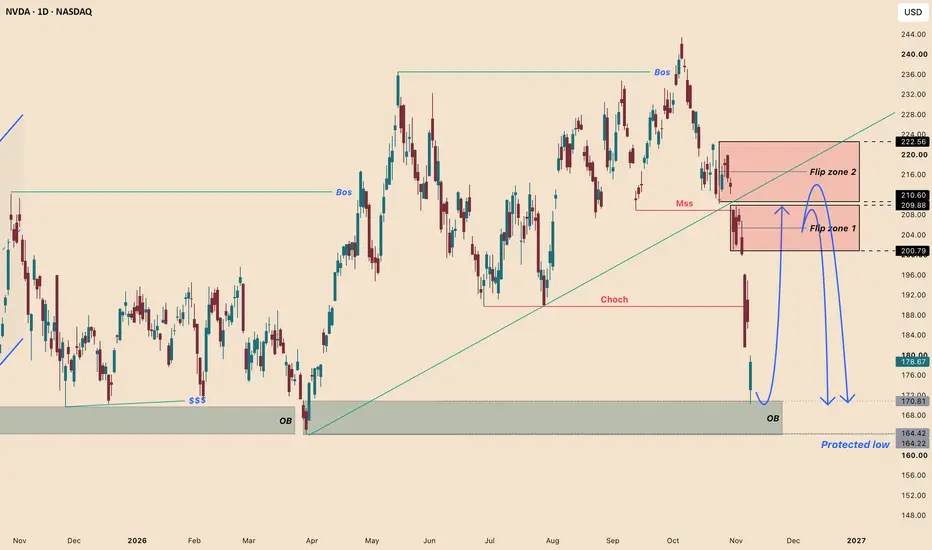
The larger trend was bullish and it was not subtle: repeated BOS to the upside, each one launched from the same demand, carrying price from the $170s to $243 over the year. The Order Block at $164.42 – $170.81 is where that entire advance originated.
That phase has now ended. Price printed a bearish MSS at $209.88 and followed it with a bearish CHoCH — the structure that drove the uptrend has been broken, and the immediate trend is down with force.
━━━━━━━━━━━━━━━━━━━━
WHERE PRICE IS NOW
━━━━━━━━━━━━━━━━━━━━
Price trades at $178.67, having fallen directly into the Order Block at $164.42 – $170.81 — the strongest demand on the chart and the origin of the whole bullish run. The session low at $170.24 tapped straight into its upper edge.
Beneath it sits the Protected Low at $164.22. That is the last defended level of the original structure.
A violently broken trend arriving at the strongest untested demand on the chart is the single most misread situation in trading. It is not a buy because the zone is strong. It is a location — and nothing more than that until price proves otherwise.
━━━━━━━━━━━━━━━━━━━━
STAGE ONE — THE REACTION
━━━━━━━━━━━━━━━━━━━━
The expectation is a reaction out of the Order Block toward the zones above.
But the trend is bearish, and that changes the standard of proof entirely. Buying demand inside a confirmed downtrend without confirmation is how accounts are destroyed — the move that reaches the zone is the same move that is designed to look like support.
The confirmation required is a bullish MSS together with a bullish FVG on a lower timeframe, printed from inside the Order Block. The MSS says local selling structure has broken. The FVG — the imbalance left by the displacement that created it — gives the entry a defined level to execute into instead of a guess.
If that sequence does not appear, there is no entry. None. Not a smaller position, not an early one. The zone can be traded straight through, and in a downtrend of this character that outcome is entirely available.
━━━━━━━━━━━━━━━━━━━━
STAGE TWO — THE ZONES ABOVE
━━━━━━━━━━━━━━━━━━━━
If the reaction comes, the destination is one of two bands overhead:
Flip Zone 1 at $200.79 – $209.88 — the nearer band, capped by the level where the bearish MSS printed.
Flip Zone 2 at $210.60 – $222.56 — the band above it.
Both were support on the way down and both are now supply. Price reaching either is not a continuation signal — it is the long trade reaching its objective and the second trade reaching its location.
From whichever of those zones price rejects, the expectation turns back down, with the sell-side liquidity below as the objective — the pools beneath the Order Block, marked on the chart.
There is one more reason those bands matter. The ascending trendline that carried the entire advance from April has been broken, and it now runs directly through both Flip Zones. A broken trendline being retested from beneath, inside a flipped supply band, is confluence rather than coincidence — which is why price reaching either zone is the expected end of the first trade and not the start of a new uptrend.
And the same standard applies in reverse. No short is taken because price arrived at a Flip Zone. A bearish confirmation on a lower timeframe is required first, exactly as the long required a bullish one. This is the most important sentence in the plan: in both directions, the zone is the location and the lower-timeframe shift is the signal.
━━━━━━━━━━━━━━━━━━━━
FUNDAMENTAL BACKDROP
━━━━━━━━━━━━━━━━━━━━
The timing of this zone test is not an accident, and the calendar is the dominant fact.
Nvidia reports fiscal Q3 2027 on November 17. Management guided to roughly $108 billion in revenue, plus or minus 2% — about 89% year-over-year growth — and consensus sits slightly above it at $108.9 billion with EPS of $2.47, implying around 91% revenue growth and 90% earnings growth. For context, fiscal Q2 delivered $96.2 billion in total revenue, $89 billion of it data center, up 117% year-over-year, with EPS of $2.46 and a 75% gross margin. Guidance assumes no data center revenue from China at all.
So the operating business is not the problem. Price is. NVDA closed at $178.67, down 4.27% on the session, with a range of $170.24 – $179.92 and a 52-week range of $164.27 – $243.37 — roughly 27% below the high. Note where that 52-week low sits: $164.27, within a few cents of the Protected Low at $164.22. The structural level and the year's floor are the same price.
What has changed is sentiment rather than fundamentals: concerns over the sustainability of AI infrastructure spending, the prospect of regulation, and a shift in positioning around AI names since the midterm elections. There is also a governance overhang — Nvidia's board has opened an independent investigation following reports concerning CEO Jensen Huang's relationship with a woman suspected of ties to Chinese intelligence; Huang has acknowledged an extramarital affair and the intelligence allegations remain unresolved.
A zone being tested a week before a print of this magnitude is a zone that gets tested with real force. That is exactly why the confirmation requirement is non-negotiable here.
━━━━━━━━━━━━━━━━━━━━
WHAT KEEPS THIS VALID
━━━━━━━━━━━━━━━━━━━━
The reaction scenario lives while price holds the Protected Low at $164.22.
And the rule that governs every level named here: a break is a candle close, not a wick. The tap to $170.24 broke nothing. Nor will a wick through $164.22, nor a wick into either Flip Zone. Only closes count — in both directions, on both trades.
This analysis will be updated as the market evolves.
Best Regards, BigBeluga 🐳
━━━━━━━━━━━━━━━━━━━━
THE STRUCTURE
━━━━━━━━━━━━━━━━━━━━
The larger trend was bullish and it was not subtle: repeated BOS to the upside, each one launched from the same demand, carrying price from the $170s to $243 over the year. The Order Block at $164.42 – $170.81 is where that entire advance originated.
That phase has now ended. Price printed a bearish MSS at $209.88 and followed it with a bearish CHoCH — the structure that drove the uptrend has been broken, and the immediate trend is down with force.
━━━━━━━━━━━━━━━━━━━━
WHERE PRICE IS NOW
━━━━━━━━━━━━━━━━━━━━
Price trades at $178.67, having fallen directly into the Order Block at $164.42 – $170.81 — the strongest demand on the chart and the origin of the whole bullish run. The session low at $170.24 tapped straight into its upper edge.
Beneath it sits the Protected Low at $164.22. That is the last defended level of the original structure.
A violently broken trend arriving at the strongest untested demand on the chart is the single most misread situation in trading. It is not a buy because the zone is strong. It is a location — and nothing more than that until price proves otherwise.
━━━━━━━━━━━━━━━━━━━━
STAGE ONE — THE REACTION
━━━━━━━━━━━━━━━━━━━━
The expectation is a reaction out of the Order Block toward the zones above.
But the trend is bearish, and that changes the standard of proof entirely. Buying demand inside a confirmed downtrend without confirmation is how accounts are destroyed — the move that reaches the zone is the same move that is designed to look like support.
The confirmation required is a bullish MSS together with a bullish FVG on a lower timeframe, printed from inside the Order Block. The MSS says local selling structure has broken. The FVG — the imbalance left by the displacement that created it — gives the entry a defined level to execute into instead of a guess.
If that sequence does not appear, there is no entry. None. Not a smaller position, not an early one. The zone can be traded straight through, and in a downtrend of this character that outcome is entirely available.
━━━━━━━━━━━━━━━━━━━━
STAGE TWO — THE ZONES ABOVE
━━━━━━━━━━━━━━━━━━━━
If the reaction comes, the destination is one of two bands overhead:
Flip Zone 1 at $200.79 – $209.88 — the nearer band, capped by the level where the bearish MSS printed.
Flip Zone 2 at $210.60 – $222.56 — the band above it.
Both were support on the way down and both are now supply. Price reaching either is not a continuation signal — it is the long trade reaching its objective and the second trade reaching its location.
From whichever of those zones price rejects, the expectation turns back down, with the sell-side liquidity below as the objective — the pools beneath the Order Block, marked on the chart.
There is one more reason those bands matter. The ascending trendline that carried the entire advance from April has been broken, and it now runs directly through both Flip Zones. A broken trendline being retested from beneath, inside a flipped supply band, is confluence rather than coincidence — which is why price reaching either zone is the expected end of the first trade and not the start of a new uptrend.
And the same standard applies in reverse. No short is taken because price arrived at a Flip Zone. A bearish confirmation on a lower timeframe is required first, exactly as the long required a bullish one. This is the most important sentence in the plan: in both directions, the zone is the location and the lower-timeframe shift is the signal.
━━━━━━━━━━━━━━━━━━━━
FUNDAMENTAL BACKDROP
━━━━━━━━━━━━━━━━━━━━
The timing of this zone test is not an accident, and the calendar is the dominant fact.
Nvidia reports fiscal Q3 2027 on November 17. Management guided to roughly $108 billion in revenue, plus or minus 2% — about 89% year-over-year growth — and consensus sits slightly above it at $108.9 billion with EPS of $2.47, implying around 91% revenue growth and 90% earnings growth. For context, fiscal Q2 delivered $96.2 billion in total revenue, $89 billion of it data center, up 117% year-over-year, with EPS of $2.46 and a 75% gross margin. Guidance assumes no data center revenue from China at all.
So the operating business is not the problem. Price is. NVDA closed at $178.67, down 4.27% on the session, with a range of $170.24 – $179.92 and a 52-week range of $164.27 – $243.37 — roughly 27% below the high. Note where that 52-week low sits: $164.27, within a few cents of the Protected Low at $164.22. The structural level and the year's floor are the same price.
What has changed is sentiment rather than fundamentals: concerns over the sustainability of AI infrastructure spending, the prospect of regulation, and a shift in positioning around AI names since the midterm elections. There is also a governance overhang — Nvidia's board has opened an independent investigation following reports concerning CEO Jensen Huang's relationship with a woman suspected of ties to Chinese intelligence; Huang has acknowledged an extramarital affair and the intelligence allegations remain unresolved.
A zone being tested a week before a print of this magnitude is a zone that gets tested with real force. That is exactly why the confirmation requirement is non-negotiable here.
━━━━━━━━━━━━━━━━━━━━
WHAT KEEPS THIS VALID
━━━━━━━━━━━━━━━━━━━━
The reaction scenario lives while price holds the Protected Low at $164.22.
And the rule that governs every level named here: a break is a candle close, not a wick. The tap to $170.24 broke nothing. Nor will a wick through $164.22, nor a wick into either Flip Zone. Only closes count — in both directions, on both trades.
This analysis will be updated as the market evolves.
Best Regards, BigBeluga 🐳
הפקודה בוטלה
UPDATE — TRADE CANCELLED, NEVER ENTEREDThe confirmation never came, so the position never existed.
The post was explicit about this and it was the central condition, not a footnote: "No entry is taken simply because price has reached the zone." The requirement was a bullish MSS together with a bullish FVG on a lower timeframe, printed from inside the Order Block at $164.42 – $170.81. And the warning attached to it was equally explicit: "If that sequence does not appear, there is no entry. None. Not a smaller position, not an early one. The zone can be traded straight through, and in a downtrend of this character that outcome is entirely available."
That is exactly what happened.
What price did. It entered the Order Block and produced nothing — no MSS, no FVG, no lower-timeframe shift of any kind. Then it was traded straight through. The candle that did it wicked down to roughly $150, sweeping every stop sitting beneath the block and beneath the Protected Low at $164.22. Price now trades at $162.85, below that level.
So the setup is cancelled. Not stopped out — cancelled. There is a difference and it is the entire point of this update. A trade that was never triggered cannot lose. The strongest demand on the chart, the origin of the entire bull run, was traded through to $150, and the cost of that to anyone following this plan was zero.
Why the rule exists. This is the exact scenario the confirmation requirement is written for. The zone was correct as a location — it was the right level, identified in advance, and price did go there. Being right about the level and being right about the trade are different things, and the lower-timeframe shift is what separates them. Buying that block on arrival, because it was "strong demand," would have meant being long into a 9% flush.
Where this leaves the chart. The bearish MSS at $209.88 and the bearish CHoCH remain the governing structure, and price has now traded beneath the Protected Low at $164.22. The reaction scenario as published is finished and requires a full re-read rather than an adjustment. The Flip Zone 1 at $200.79 – $209.88 and Flip Zone 2 at $210.60 – $222.56 are still the supply bands overhead, and the broken ascending trendline still runs through them.
And the rule, one more time. A break is a candle close, not a wick — which is what kept us out, and also what tells us the structure beneath has now genuinely changed rather than merely been wicked.
We publish the trades that work and the trades that never start. This one never started.
Updated chart:
This analysis will be updated as the market evolves.
Best Regards, BigBeluga 🐳

🌐 bigbeluga.org/tv - Get access to our powerful tools & indicators.
🔵 Learn More -> docs.bigbeluga.org/
🔵 Join Discord -> go.bigbeluga.org/k65q9bfqfu
All content provided by BigBeluga is for educational purposes only
🔵 Learn More -> docs.bigbeluga.org/
🔵 Join Discord -> go.bigbeluga.org/k65q9bfqfu
All content provided by BigBeluga is for educational purposes only
כתב ויתור
המידע והפרסומים אינם מיועדים להיות, ואינם מהווים, ייעוץ או המלצה פיננסית, השקעתית, מסחרית או מכל סוג אחר המסופקת או מאושרת על ידי TradingView. קרא עוד ב־תנאי השימוש.
🌐 bigbeluga.org/tv - Get access to our powerful tools & indicators.
🔵 Learn More -> docs.bigbeluga.org/
🔵 Join Discord -> go.bigbeluga.org/k65q9bfqfu
All content provided by BigBeluga is for educational purposes only
🔵 Learn More -> docs.bigbeluga.org/
🔵 Join Discord -> go.bigbeluga.org/k65q9bfqfu
All content provided by BigBeluga is for educational purposes only
כתב ויתור
המידע והפרסומים אינם מיועדים להיות, ואינם מהווים, ייעוץ או המלצה פיננסית, השקעתית, מסחרית או מכל סוג אחר המסופקת או מאושרת על ידי TradingView. קרא עוד ב־תנאי השימוש.