
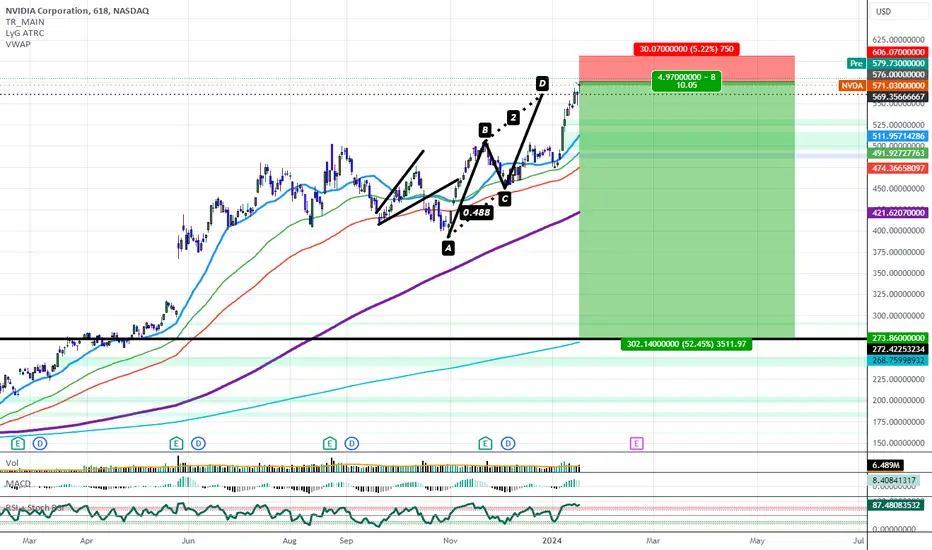
NVDA has risen above the trading range but has started to print weaker Bearish candlestick patterns on the Daily as it approached the PCZ of a potential Bearish ABCD pattern. At this point in time it seems like NVDA will fall short of $600 then come back down to its last official support level which was at $272.42, if 272.42 doesn't hold then it could go into the one hundreds or even below $100 to around $80 but $272.42 is the main target.

כתב ויתור
המידע והפרסומים אינם מיועדים להיות, ואינם מהווים, ייעוץ או המלצה פיננסית, השקעתית, מסחרית או מכל סוג אחר המסופקת או מאושרת על ידי TradingView. קרא עוד ב־תנאי השימוש.
כתב ויתור
המידע והפרסומים אינם מיועדים להיות, ואינם מהווים, ייעוץ או המלצה פיננסית, השקעתית, מסחרית או מכל סוג אחר המסופקת או מאושרת על ידי TradingView. קרא עוד ב־תנאי השימוש.