

🔸 4H CHART EXPLANATION:
.
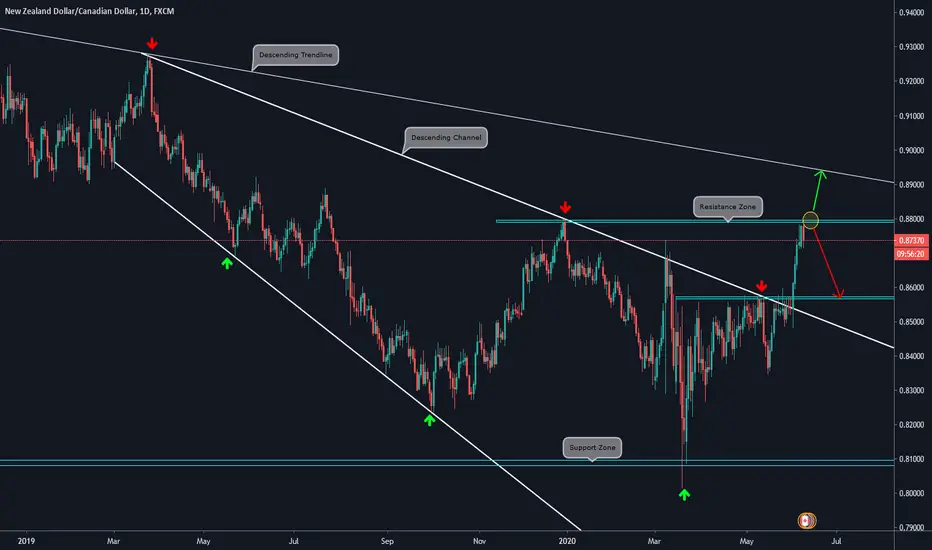
🔸 Price broke the Descending Trendline and made a strong upside move.
.
🔸 Now, it is facing the Resistance Zone.
.
🔸 We are waiting for a definition here. If price breaks to the upside, then the target would be the Descending Trendline, and, if price bounces, then the target zone is the Support Zone.
.
🔸 Will look for a lower timeframe setup when the direction is clear.
🔸 DAILY CHART ANALYSIS:

.
🔸 Price broke the Descending Trendline and made a strong upside move.
.
🔸 Now, it is facing the Resistance Zone.
.
🔸 We are waiting for a definition here. If price breaks to the upside, then the target would be the Descending Trendline, and, if price bounces, then the target zone is the Support Zone.
.
🔸 Will look for a lower timeframe setup when the direction is clear.
🔸 DAILY CHART ANALYSIS:

כתב ויתור
המידע והפרסומים אינם מיועדים להיות, ואינם מהווים, ייעוץ או המלצה פיננסית, השקעתית, מסחרית או מכל סוג אחר המסופקת או מאושרת על ידי TradingView. קרא עוד ב־תנאי השימוש.
כתב ויתור
המידע והפרסומים אינם מיועדים להיות, ואינם מהווים, ייעוץ או המלצה פיננסית, השקעתית, מסחרית או מכל סוג אחר המסופקת או מאושרת על ידי TradingView. קרא עוד ב־תנאי השימוש.