

NZD/CAD:SELL From 61.8% FIBO Resistance AREA DIV RSI SHORT
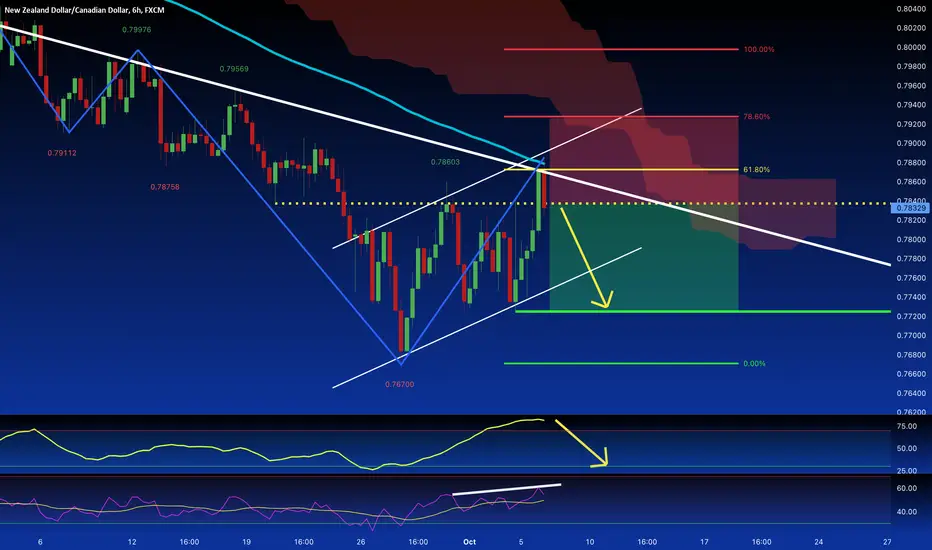
NZD/CAD comes from a solid bearish trend, in the last sessions, the price had a retracement to the 61.8% Fibonacci retracement whereas today the market opened with a strong bearish candle. At this price, the level is placed some static resistance and the dynamic trendline. The 100 Moving average had worked like a rebound point where the candle turned bearish and the indicators, the RSI ( in divergence ), and the Stochastic show a drop-down pattern.
הערה

כתב ויתור
המידע והפרסומים אינם מיועדים להיות, ואינם מהווים, ייעוץ או המלצה פיננסית, השקעתית, מסחרית או מכל סוג אחר המסופקת או מאושרת על ידי TradingView. קרא עוד ב־תנאי השימוש.
כתב ויתור
המידע והפרסומים אינם מיועדים להיות, ואינם מהווים, ייעוץ או המלצה פיננסית, השקעתית, מסחרית או מכל סוג אחר המסופקת או מאושרת על ידי TradingView. קרא עוד ב־תנאי השימוש.